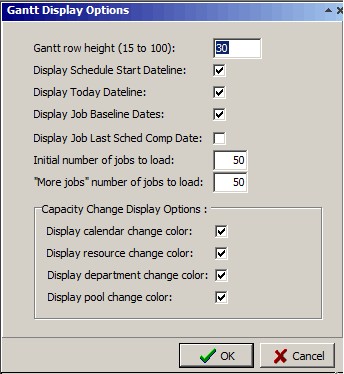
The Job Gantt Chart has the following options that are selected from the View | Gantt Display Options:
Gantt row height (15 to 100). This option enables you to select the height of each of the Gantt chart rows. Valid entries are from 15 to 100. The default is 35.
Display Schedule Start Dateline. If selected, the schedule start date will appear on the graph as a solid blue line with “Schedule Start” written vertically to the right side of the dateline. If not selected, the schedule start dateline will not appear.
Display Today Dateline. If selected, a dashed blue dateline will appear on the corresponding date column of the graph. If not selected, today’s dateline will not appear.
Display Job Baseline Dates. If selected, markers for the job baselines dates will appear with indicating the baseline start date and indicating the baseline end date. If not selected, the baseline dates do not appear.
Display Job Last Schd Comp Date. If selected, the job’s last schedule completion date is display using the symbol . If not selected, the symbol does not appear.
Initial number of jobs to load. This value sets the number of jobs to load when the Job Gantt Chart is selected from the Mfg Orders Job Grid Graph menu.
“More jobs” number of jobs to load. This value is the number of additional jobs to load each time the More Jobs button is pressed.
Display calendar change color. If selected, calendar changes will appear on the graph.
Display resource change color. If selected, resource changes will appear on the graph.
Display department change color. If selected, department changes will appear on the graph.
Display pool change color. If selected, pool changes will appear on the graph.