The Schedule Board is an excellent tool to view the results of a schedule run as well as enabling you to make any desired manual changes before the results are dispatched to the shop floor. You can gather similar operations together, adjust operations to fit on certain day, select to load operations infinitely for future schedule runs, lock an operation on the selected dates, move an operation to a new resource, and more.
From Mfg Orders Job Grid, select Graphs | Schedule Board. When you first enter into the Schedule Board, the resource selections window is displayed asking you the resources you want to display in the Schedule Board. You can also select the resources while in the Schedule Board by using either File | Resource Selections or View | Resource Selections.

After selecting the resources you want to see on the schedule board, the following Schedule Board window appears:

Using the mouse, you can select a bar and drag and drop that bar to a new date or a new resource. Note that when you drag a bar, you can drag the bar left or right and then drop the bar, or you can drag the bar up and down and drop the bar. You cannot drag a bar left/right and up/down at the same time.
As you move each operation bar, DMS schedules the moved bar infinitely. That is, DMS may overload a resource so that it fits onto the date and/or new resource where the operation bar was dropped.
Hovering the mouse cursor over a bar will popup more information on the bar.
The following example shows that operation bars where dragged and dropped onto the first day of the schedule thus overloading the first day as show in the capacity bar graph (the first blue bar load is above the red bar capacity) at the top right side of the window example:

The rules for dragging and dropping a bar are:
- You can drag a bar to the left to move its start date to an earlier date, or to the right to move the start date to a later date. If you drag the bar to a date before the schedule start date, the Schedule Board will schedule the operation start date to start at the schedule start date.
- When you drag a bar, you can drag the bar left or right and then drop the bar, or you can drag the bar up and down and then drop the bar. You cannot drag a bar left/right and up/down at the same time.
- You can drag a bar on top of another bar; the scheduler will adjust accordingly.
- If you drag and drop an operation bar that has an AND command, both the operation bar and the AND operation(s) will be rescheduled infinitely.
- Scheduled in process operation bars are displayed in green with a middle bar showing the percent complete as in
 . In this example, the operation is about 50% complete.
- Scheduled operation bars are displayed in light blue as in
 .
.
- An operation bar that is locks is displayed with a lock icon as in
 .
.
- An operation bar that is set by the user to be infinitely loaded appears with a magenta boarder as in
 .
.
You can select to see just a Gantt chart by clicking on the full screen icon  at the top right side of the Gantt chart. To restore the window to the original format, slick on the restore icon
  .
.
Right click on a bar pops up a menu as in the example below:

This popup menu enables you to:
- Lock or Unlock an operation on the current dates. A lock icon will appear on the bar of any locked operations.
- Infinite Load or Finite Load an operation during a schedule run. If an operation is to be infinitely loaded, the operations bar is surrounded with a magenta border color.
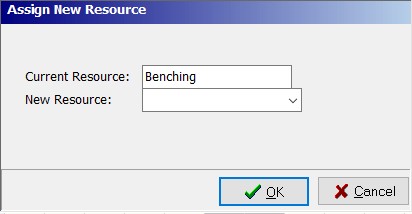
- Assign a new resource enables the user to change the current resource to a new resource. The new resource does not need to be displayed in the Schedule Board. When selected, the following windows appears enabling you to assign a new resource:
- Link Operations select this command to display the Linked Operations Window to link two or more operations together
- Undo or Redo the drag and drop bar moves during the Schedule Board session. Note that the undo and redo will also undo and redo locking/unlocking operation on dates and setting operations to finite/infinite.
- Edit Job to edit the current job
- Edit Job/Operations to edit the current job's operations.
- Update Job
- Quick Job Updating
- Start/Stop Clock Updating.
- Edit Resource is selected to to edit the Resource
- Capacity Changes to add Calendar/Capacity changes for future schedule runs.
The following commands are available:
- Resource Selections File | Resource Selections enables you to select new resources to be displayed in the schedule board.
- Print Report Selecting File | Print or clicking on the print icon
 to print a DMS Report as setup by Module Report Settings.
- Print Graph Selecting File | Print or clicking on the print graph icon
 to print the current Gantt chart.
- Overlay Bars If View | Overlay bars is selected, the bars shown on the graph are overlayed on top of each other. This option can be toggled on or off.
- Resource Gantt Display Options Select View | Gantt Display Options to select display options for the Gantt Chart.
- Show Labels If View | Show Labels is selected, the bars on the graph will be shown with labels displaying the numerical total of each bar. This option can be toggled on or off.
- Percent Load If View | Percent Load is selected, the the graph bars will display the percentage load. This option can be toggled on or off.
- Theme The View | Theme enables you to change the appearance of the graph. Various themes and colors can be selected.
- Refresh View | Refresh reloads the graph with fresh data.
- Sort The following sort settings are available for sorting the operations under each resource:
- Sort by operation start date.
- Sort by start date and previous operation status
- Sort by previous operation status and start date
- Sort by operation start date, status, and previous operation status.
- Time Scale The Time Scale for the capacity graph can be one of the following:
- Hours
- Days
- Weeks
- Months
- Quarters
- Type of Work (Capacity) The type of work appears above the capacity graph for the capacity bars (orange bars) and can be changed by selecting a new type of work.
- Type of Work (Ribbon) A ribbon can be added as a third parameter to the capacity graph displaying a different type of work. The ribbon enables you to compare the capacity type of work, the current load, and a ribbon type of work all in one graph. The Type of Work Ribbon prompt appears above the capacity graph.
- Data points The data points appears above the capacity graph and are the number of shifts, days, weeks, months or quarters you want to appear on the graph.
Note when changing to or from Shifts, selecting different sort orders, or selecting and entering a new number of dispatch days out, the Gantt chart must recalculate and load the data.

