Dashboard
Previous Topic  Next Topic 

The Mfg Orders Job Grid Dashboard enables you to take a quick snapshot of on-time performance.  The Dashboard displays The percent of late jobs to on-time jobs based on the due date, and a second comparison of the percent of late jobs to on-time jobs based on the the baseline end date or the promise date.


To display the dashboard, from Mfg Orders Job Grid either click on the dashboard icon , select Graphs | Dashboard, or select File | Graphs | Dashboard.  


The example below shows the Dashboard window comparing the due date on the first line of graphs to the baseline end date on the second line of graphs:


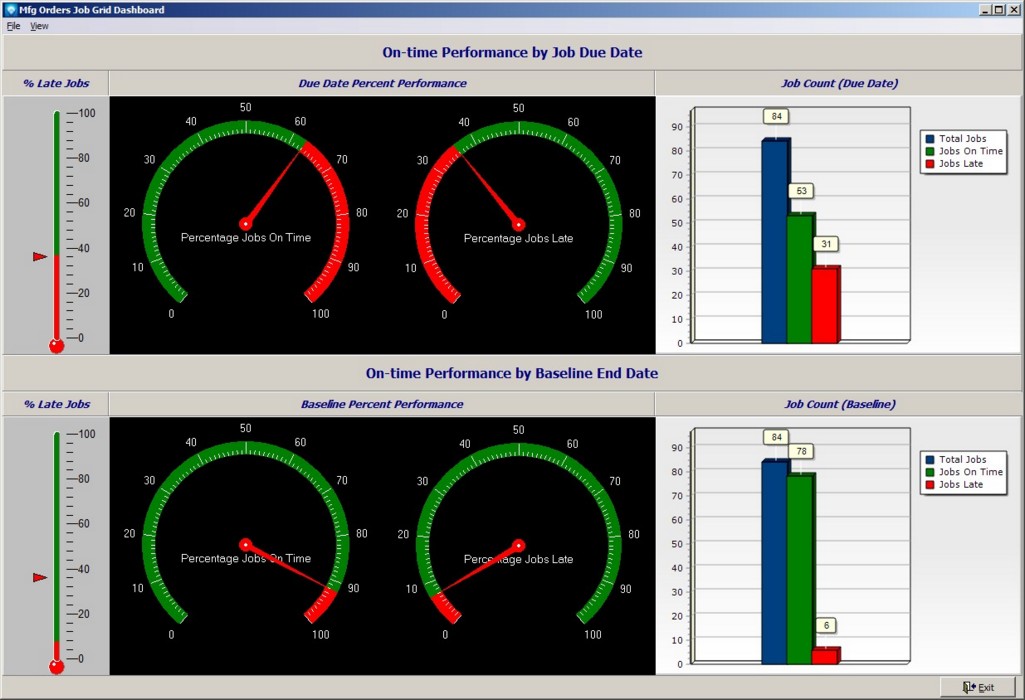
The Dashboard displays the following information (from top right to left):


  1. % Late Jobs  The thermometer display the percentage of late jobs using the due date in red.  The red triangle to the left side of the bar indicates the percentage late.  The percentage late jobs based on the due date is also shown on the % Late Jobs thermometer on the second line for ease of comparing the baseline or promise date late to due date late.
  2. Due Date Percent Performance  The due date percent performance shows two meters; the first shows the percentage of jobs on time using the due  date and the second meter shows the percentage of jobs late using the due date.
  3. Job Count (Due Date) The graph displays three bars showing total jobs, jobs on time, and jobs late using the due date.
  4. % Late Jobs  The second line thermometer displays the percentage of late jobs in red for either baseline end date or the promise date, depending on the selected date. The red triangle indicates the percentage late jobs using due date late for ease of comparing to the due date late jobs.
  5. Percent Performance  The percent performance shows two meters; the first shows the percentage of jobs on time using either the baseline end date or the promise date and the second meter shows the percentage of jobs late using either the baseline end date or the promise date 
  6. Job Count  The graph displays three bars showing total jobs, jobs on time, and jobs late using either the baseline end date or the promise date.


Valid commands are:


  1. Baseline Display  Select View | Baseline Display to toggle on or off the baseline graph (the second line of graphs).
  2. Use Promise Date  Select View | User Promise Date to toggle on or off using the promise date for the baseline graph.  If selected, the promise date is used for the baseline graph.  If not selected, the baseline end date is used.