The Capacity Graph displays the loaded capacity for a resource, pool, or department. Either the loaded capacity or the percent load can be viewed on the graph. Three types of bars and a "ribbon" can be graphed showing:
- Capacity available for the resource, pools, or department (orange bar)
- The loaded capacity or percent load (blue bar)
- One or more selected jobs and their total load (green bar)
- Ribbon showing a selected type of work
To select the resource to graph, click on a resource in the tree. If graphing pools or departments, the pools or departments will appear in the tree enabling you to make selections.
The bar colors, bar style (bar shape), and whether or not to display a bar can be selected using View | Set Bar Options.
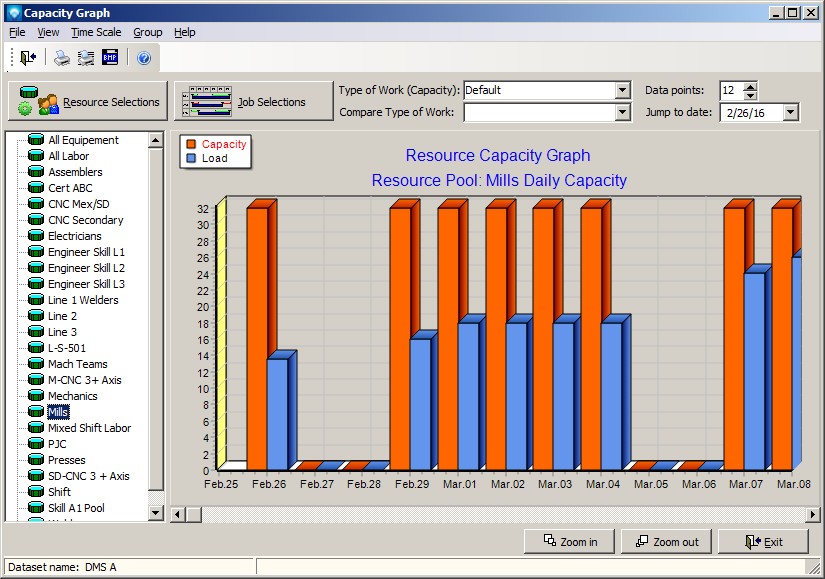
The capacity graph below shows the capacity available (orange bar) and the loaded capacity (blue bar) for the resource CNC 3A1 using a time scale of days:

Valid commands are:
- Print Report Select File | Print or click on the print icon
 to print a Crystal Report as setup by Module Report Settings.
- Print Graph Select File | Print or click on the print graph icon
 to print the current graph.
- Write to BMP Select File | Write to BMP or click on the BMP icon
 to write the selected resources to a bit map image file. It is recommended no more than 6 resources at a time be written to the BMP file otherwise the image is too cluttered.
- View Dispatch Display You can view the dispatch display for the current operation by clicking on a bar in the capacity graph. The dispatch display will appear for the selected resource.
- Overlay Bars If View | Overlay bars is selected, the bars shown on the graph are overlayed on top of each other. This option can be toggled on or off.
- Show Labels If View | Show Labels is selected, the bars on the graph will be shown with labels displaying the numerical total of each bar. This option can be toggled on or off.
- Percent Load If View | Percent Load is selected, the the graph bars will display the percentage load. This option can be toggled on or off.
- Pool Load If View | Pool Load is selected and grouping by Pools, the operation load assigned to a pool is displayed. When grouping by Pools the load bars show all resources that are in the pool even if the operation has not been specifically assigned by the user to the pool. If Pool Load is selected, then another bar appears on the graph that shows operations that have been assigned by the user to the pool. For example, if there are two operations such as:
Operation Pool Resource Hours
10������� Mills Mill 1���� 5 hours
20������������� Mill 1���� 2 hours
When you ask for the capacity graph to group by pools, it will display the Mills pool as having a total of 7 hours because Mill 1 is in the pool Mills.� If you ask to see the specific pool load assigned by the user, a third bar will appear that displays 5 hours as an operation was assigned the Mills pool. This enables you to see the resource load for all resources in a pool as well as the load assigned by the user to the pool.
- Resource Selections You can select certain resources, pools or departments to graph using Resource Selections. You can also save the current Resource selection and then recall the saved selection as required. To save a resource selection:
- Click on the Resource Selections button.
- Select the resources you want to save. Click the OK button in the Resource Selections window. The capacity graph will display the capacity of the selected resources.
- Select the command File | Save User Search. DMS will ask you to verify the save. Click Yes to save the search or click No to ignore the save.
- You can recall your saved search by either selecting File | Run User Search or click on the run user search icon
 in the tool bar.
- To clear a saved search display, click on the Resource Selections button, click Clear, verify the clear by clicking OK, and then click the OK button in the Resource Selections window.
- Job Load If View | Job Load is selected, a green bar representing the selected jobs will be graphed. To select jobs to graph, click on the Job Selections button and the Job Selections window will appear.
- Resource Count If View | Resource Count is selected, the number of resources (labor or machines) for each time period is displayed on the graph as a cyan colored bar. DMS calculates the resource count by: Hours per Shift / Hours per Operation.
- Head Count If View | Head Count is selected, the head count for each time period is displayed on the graph as a yellow colored bar. DMS calculates the head count by: Loaded Capacity / Head Count Hours. The head count hours is set in Terms and Settings.
- Theme The View | Theme enables you to change the appearance of the graph. Various themes and colors can be selected.
- Refresh View | Refresh reloads the graph with fresh data.
- Time Scale The Time Scale for the capacity graph can be one of the following:
- Shifts
- Days
- Weeks
- Months
- Quarters
- Type of Work (Capacity) The type of work above the capacity graph for the capacity bars (orange bar) can be changed by selecting a new type of work.
- Compare Type of Work A ribbon can be added as a third parameter to the capacity graph displaying a different type of work. The ribbon enables you to compare the capacity type of work, the current load, and a ribbon type of work all in one graph. The Type of Work Ribbon prompt appears above the capacity graph.
- Data points The data points above the capacity graph and are the number of shifts, days, weeks, months or quarters you want to appear on the graph.
- Jump to Date The jump to date allows you to enter a date and have the Capacity Graph jump to that date and display the load on that day.
The Capacity Graph has a command where if you right click on a bar, The following popup menu appears enabling you to select a Capacity Pie Chart showing the hourly load by jobs, job identification, part number or job state. Once the pie chart has been displayed, you can switch between any of the four views:

The example below shows the capacity graph with the type of work "2nd Shift OT" added to the graph as a ribbon as well as the capacity head count in red, the load head count in yellow, the "2nd Shift OT" capacity as a blue ribbon, and the "2nd Shift OT" head count in cyan:

The example below shows the capacity, the load, the 2nd shift OT capacity and the amount of time used by the selected jobs (green bar). To select jobs or see what job selections have been made, the Job Selections button is clicked on:

The example below shows a capacity graph grouped by pools. Clicking on a pool in the tree will display the total resources' capacities and load in the selected pool:
The example below shows a capacity graph grouped by departments. Clicking on a department in the tree graphs will display the total resources' capacities and load in the department:


