Assembly Gantt Chart
Previous Topic  Next Topic 

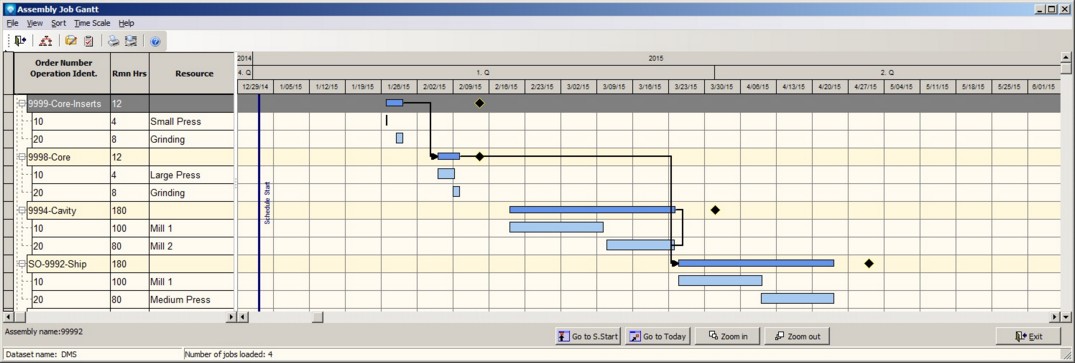
The Assembly Gantt Chart displays one or more assemblies and the component relationships in a Gantt chart format.  One assembly job or a range of assembly jobs can be selected.


When you first enter the Assembly Gantt Chart, a blank Gantt chart is displayed.  Select File | Assembly to Graph, or click on the Assembly icon to enter the assembly you wish to graph.  The initial assembly Gantt chart defaults to be sorted by level of the assemblys component jobs.  When sorted by level, job links between components are drawn in blue.  You can change the component job sort order, but if the Gantt chart is not sorted by level, the relationship(s) between the component jobs is not displayed.


Example screen of the Assembly Gantt Chart:


Valid commands are:


  1. Edit Job Highlight the job or job/operation bar to edit, right click to pull up the menu and select Edit Job/Operations or select File | Edit Job or click on the edit icon .
  2. Update Job Update a job using Job Status Updating by highlighting the job or operation within a job and either right click and select Update Job or select File | Job Updating or click on the job updating icon .
  3. Quick Job Updating Update a job using Quick Job Updating by using the right mouse button and click on a job or operation in the tree view.
  4. Print Gantt  Select File | Print Gantt to print the current Gantt chart. 
  5. Print Report Select File | print Report to print a DMS Report as setup by Module Report Settings.
  6. Expand All  Right click on the job/operation tree and select Expand All from the pop up menu to expand all the jobs' operations in the graph.
  7. Collapse All  Right click on the job/operation tree and select Collapse All from the pop up menu to collapse all the jobs' operations in the graph.
  8. Job Expand Right click on the job/operation tree and select Job Expand from the pop up menu to expand the job's operations in the graph.
  9. Go to Job Start  Click on the Go to S.Start on the bottom of the graph or right click on the job/operation tree and select Go to Job Start to move the graph date scale to the start of the current job.
  10. Go to Today  Click on the Go to Today on the bottom of the graph to move the graph date scale to today's date.
  11. Go to Job End  Right click on the job/operation tree and select Go to Job End to move the graph date scale to the start of the current job.
  12. Display Selected Operations  You can select certain operations only to be displayed in the graph.  One of the following can be selected:
    1. Select View | Display All Operations to display all operations.
    2. Select View | Display Prime Only to display prime operations only. 
    3. Select View | Display Milestones Only displays only operations marked as Milestones.
  13. Sort  Jobs can be sorted in one of the following orders:
    1. Assembly:
      1. Assembly Start Date
      2. Assembly End Date
      3. Level (The default sort that shows the assembly relationships between component jobs).
    2. Order Number
    3. Part Number
    4. Part Number plus Start Date
    5. Job Identification
    6. Job Identification plus Start Date
    7. Start Date
    8. End Date
    9. Due Date
    10. Priority plus Due Date
  14. Time Scale The Time Scale for the graph can be one of the following:
    1. Days
    2. Weeks
    3. Months
    4. Quarters
  15. Click the zoom in button to change the time scale to the next highest detail (quarters to months to weeks to days)
  16. Click the zoom to button to change the time scale to the next lowest detail (days to weeks to months to quarters)
  17. Assembly Gantt Display Options select View | Gantt Display Options to select display options for the Gantt Chart.


For the definition of symbols used on chart, please refer to the Job Gantt Chart Legend.