DMS Report Designer
Previous Topic  Next Topic 

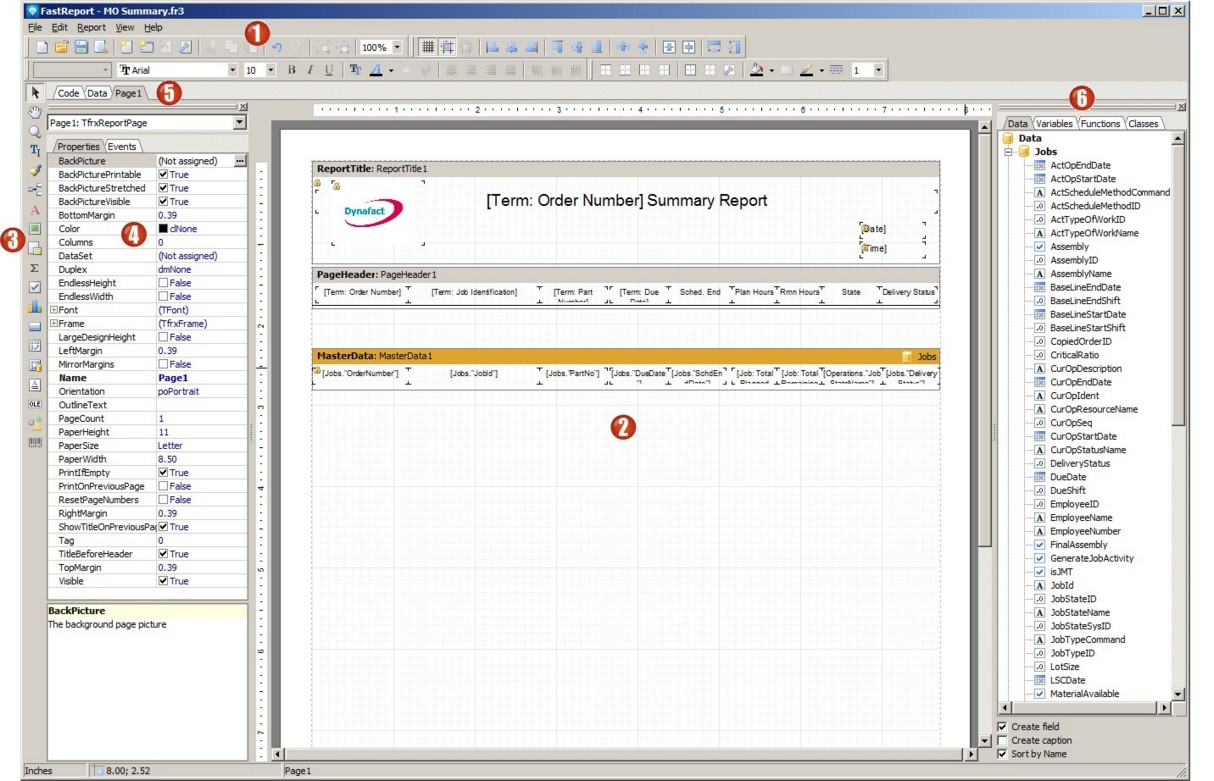
The DMS Report Designer is a powerful tool that enables you to create new report and edit existing reports.  The designer appears when you select the New ReportCopy ReportEdit Report or Add Report command.


An example of the DMS Report Designer is shown below:


Legend:


  1. The area at the top of the designer has the menus and icons used to perform commands on the report.  (Note that the Report | Data command enables you to select which DMS tables you want to appear on the report.)  See Designer Toolbars for an explanation of each toolbar.  
  2. This central area is where you design the report itself.  Data items and variables can be dragged and dropped to this report work area.
  3. This vertical menu of icons is called the Designer Menu Bar and is used frequently when building a report.  For details on each icon, please see the Designer Menu Bar.
  4. The Object Properties and events lists the properties of whatever object (item) is selected in the report area (2).
  5. The Code, Data and Page tabs.  For most reports you will be working in the Page tab area.  The Code tab is used to write Report Scripts.  The Data tab enables you to add other tables and is not sued in the DMS reports at this time.
  6. The Data, Variables, Functions and Classes tabs.  The Data tab lists the current selected DMS tables for the report.  The Variables tab has data such as DMS Terms, DMS calculated job fields, DMS calculated operation fields, etc.  The Functions tab has the following functions:
    1. Mathematical functions (Pi, Absolute value, square root, etc.)
    2. Aggregate functions (Average, Count, Min, Max, and Sum)
    3. Conversions of data functions (Integer to string, String to integer, String to date, etc.)
    4. String functions (Trim a string of blanks, Uppercase a string, Compare texts, etc.)
    5. Other functions (Create OLE object, Random number generator, etc.)
    6. Date and Time functions (Date, Get the day of the week, get the current date and time (Now), etc.)
    7. Formatting functions (Format date, format strings, etc.)


Items that have been inherited from a base report cannot be deleted when editing or creating a new report.  These items are said to be "locked" on the report and appear with a lock  beside the object.  In the above example, the ReportTitle and MasterData report bands both have a lock and this cannot be deleted.  Some of the fields (objects) within these bands are also locked (a  appears next to the field) and thus cannot be deleted.  These locked objects can, however, be moved within the band.


If you are working on a large report with a lot of objects, you can see all the object on your report by selecting the View | Toolbars | Report Tree.  If you select this toolbar view, a report tree of objects will appear at the top left side of the designer (circled in red) as in the example below.  You can use the Report Tree to select any object on the report.  In this example, the Memo1 object has been selected:


See the following for more information:

  1. DMS Report Tutorials for step by step examples on how to create a new DMS Reports.
  2. Designer Menu Bar for an explanation of the tools to design a report.
  3. Designer Toolbars for an explanation of the toolbars located at the top of the Report Designer.
  4. Variables tab for an explanation of the data fields, variables, etc. of the Report Designer. 
  5. Report Bands for information on adding report bands, such as data bands, to a report.
  6. Formatting Text Objects, Data Fields and Variables
  7. Conditional Highlighting
  8. Coloring Alternate Data Rows
  9. Report Scripts  
  10. Report Grouping
  11. Sub Reports