Coloring Alternate Data Rows
Previous Topic  Next Topic 

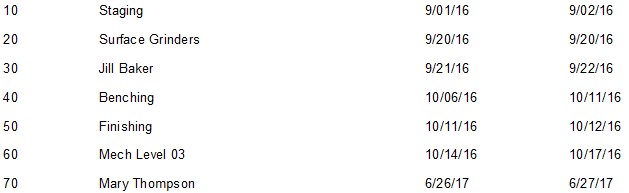
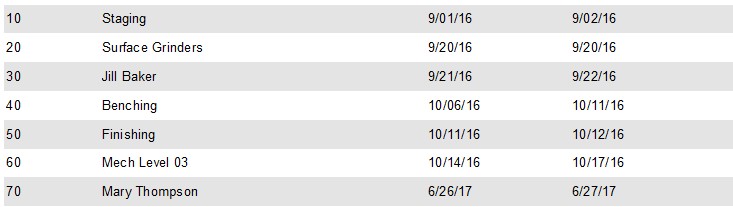
The DMS Report writer enables you to color alternate rows in a report for ease of reading.  For example, consider the two report formats below displaying the same operations:


Report with alternate rows colored:


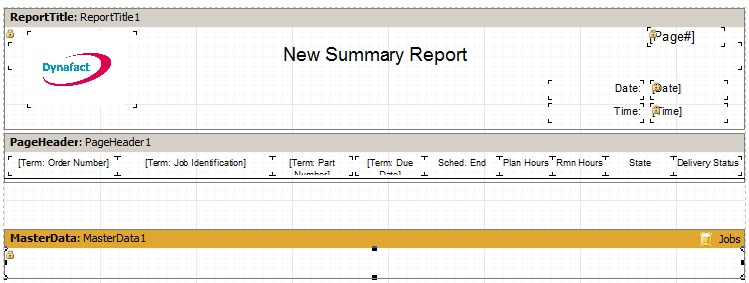
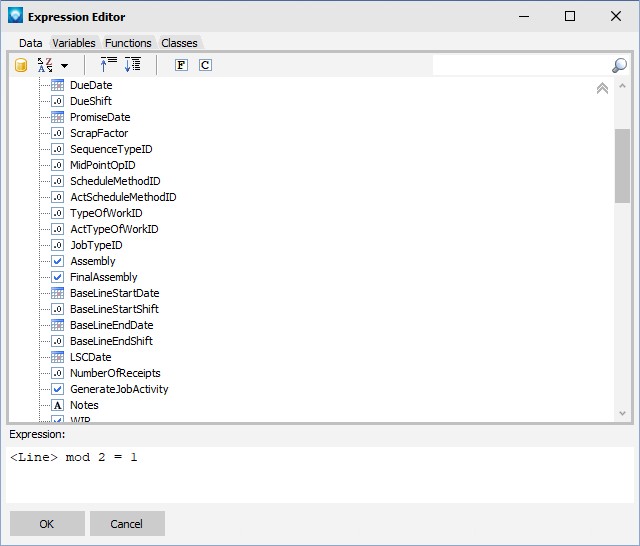
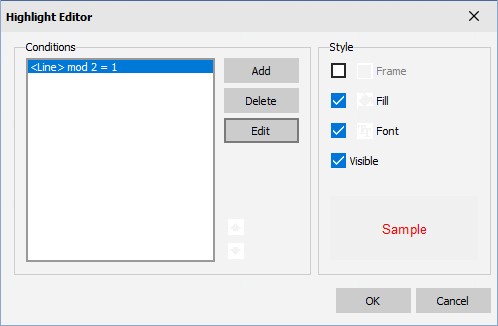
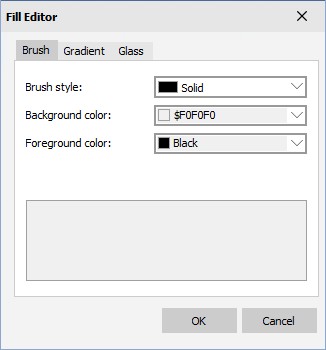
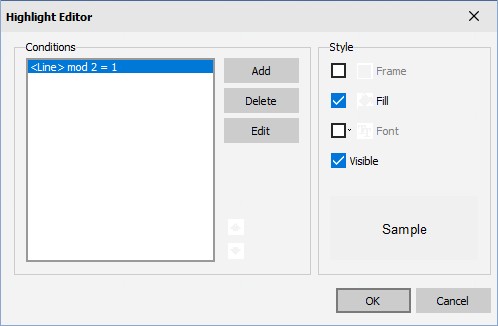
To color alternate rows on a report, a text object is placed over a data band and then the text box's conditions for highlighting are changed.  The following is a step by step method to add alternate colored rows to a report:  


  1. Add a data band to your report such as a Master Data Band for jobs or a Detail Data Band for operations.
  2. Before adding any data or variable objects to the data band, using the text editor icon  on the Designer Menu Bar to place a text box over the entire data band.  The example below shows that a text object has been added to the Master Report Band:
  3. Select the Text object and click the highlight button on the Text toolbar located at the top of the Report Designer.  The Highlight Editor will appear.  Click on the Add button and the Expression Editor will appear.
  4. In the Expression Editor, enter the expression <Line> mod 2 = 1 as in the example below.  This command takes the current line number (row) and applies the math MOD function to find the remainder.  If the remainder is 1, then the condition is true and the line is colored.  Press OK to save the expression:


  5. The Highlight Editor will appear as:


  1. Select the Fill button.  On the Brush tab, select the Background color (a lighter color is recommended over a darker color).  In the example below, a light grey background color was selected.  Click OK to save the selection:


  2. In the Highlight Editor uncheck on the Font button as in the example below.  Click OK to save the change.


  3. Click OK to save the change.  Save the report and view your report to see the changes.


Hint:  If you run the report and find the data fields are at the top of the color row, center the data fields on the text object by high lighting all the data fields (select one data field, press and hold the Shift key and select the other data fields) and pressing center vertically in band icon .  


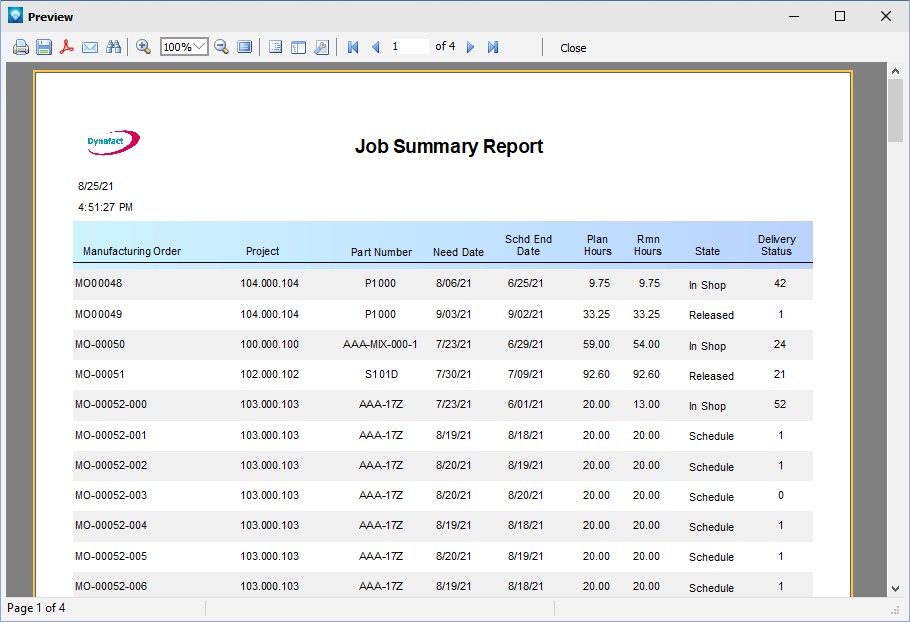
Below is an example of alternate row coloring in a job summary report: