|
Report on Jobs Tutorial
|   |
|
Report on Jobs Tutorial
| |
In this tutorial we are going to create a new report based on the DMS Report Type Jobs.
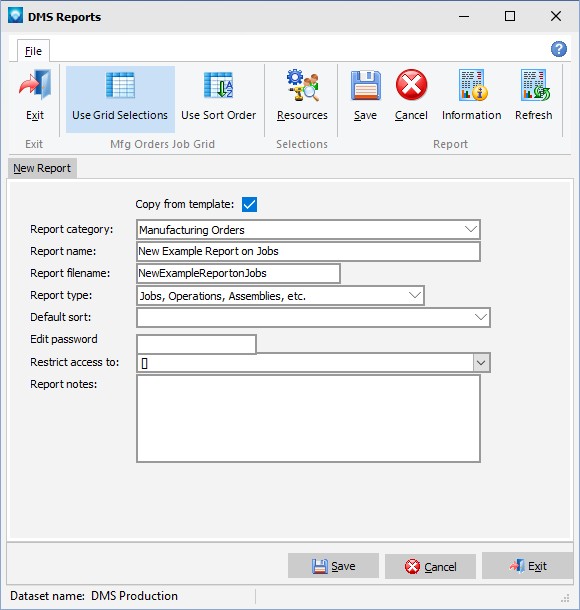
In Mfg Orders Job Grid, click on the New Report button.
DMS will display the New Report window. Enter the information as per the example below (you can use the default Report filename):
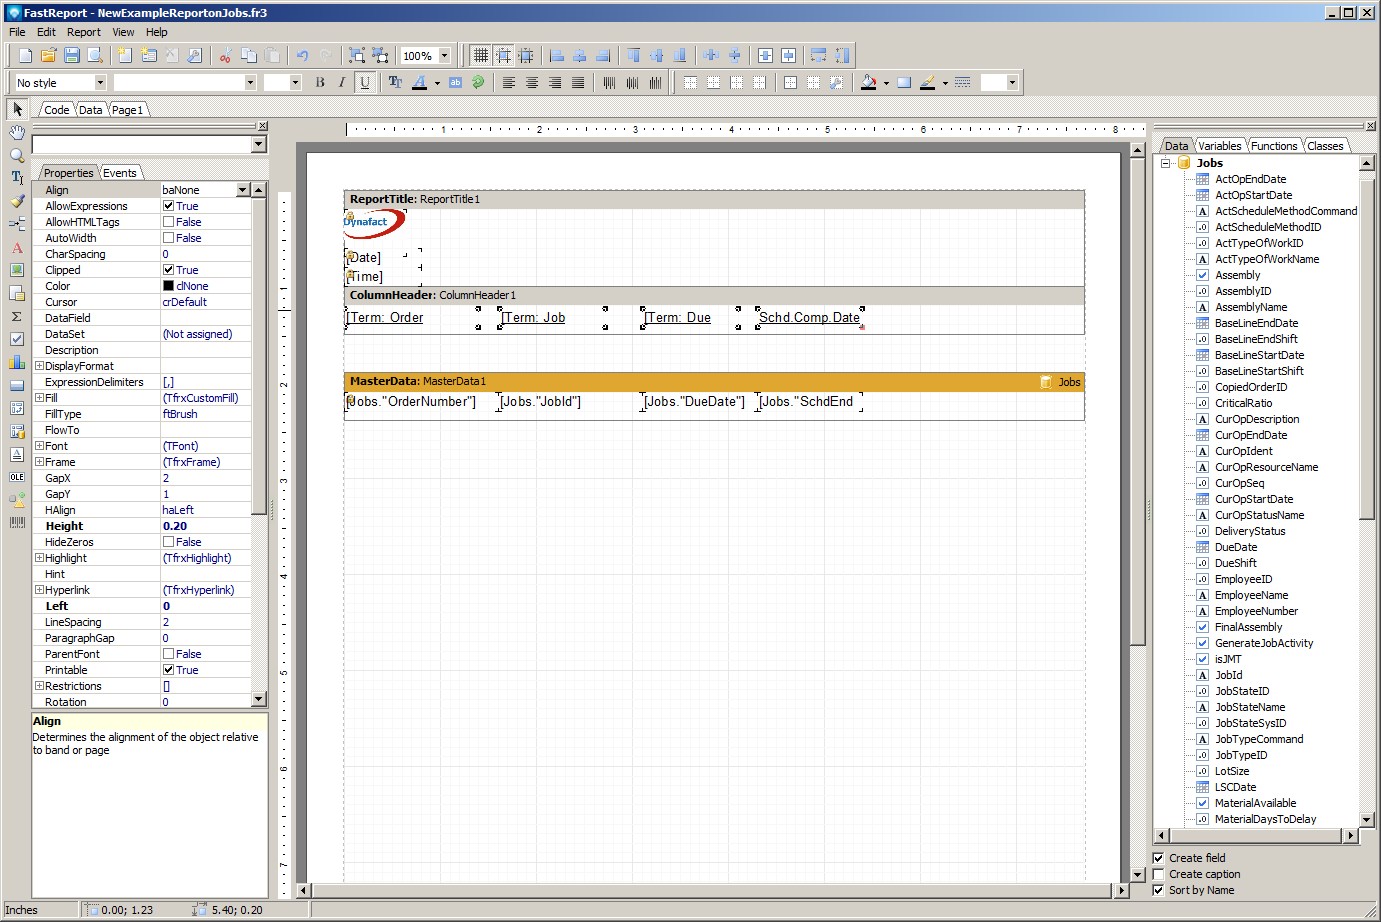
Click the Save button and the DMS Report Designer appears with information inherited from the Job Base report:
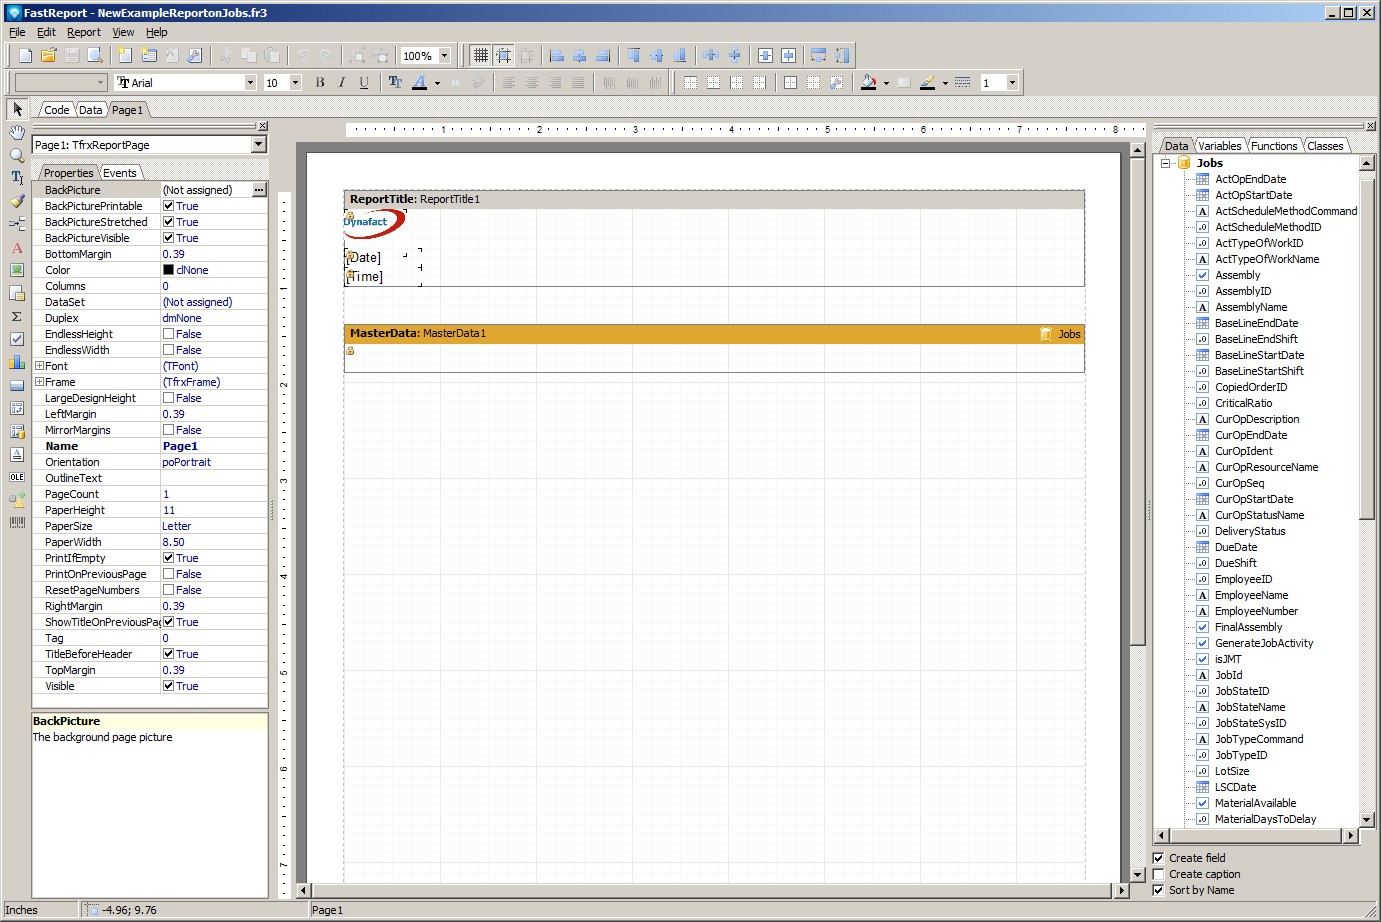
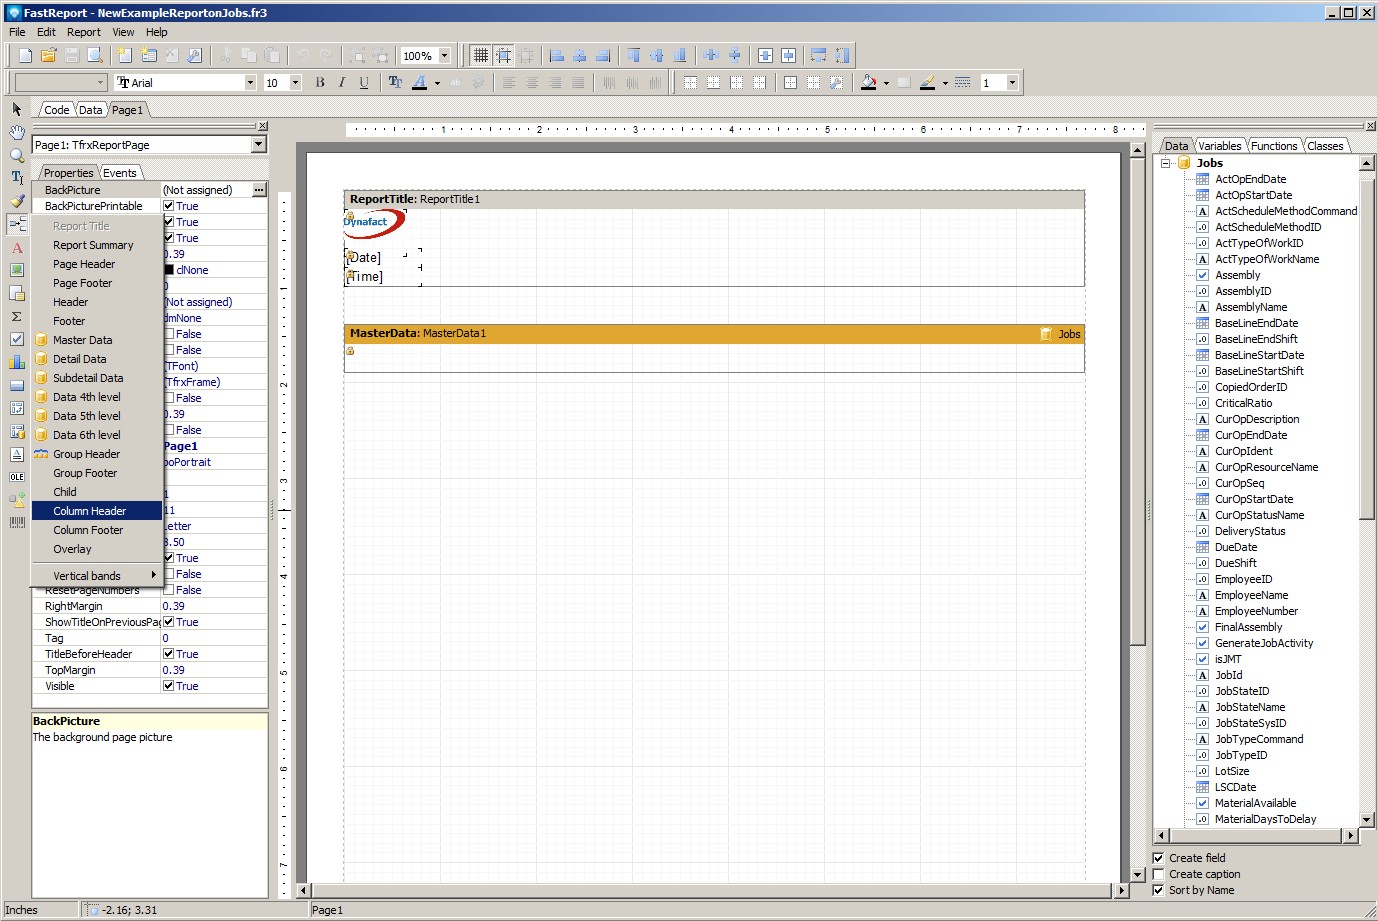
A Master Data Band is added automatically with the Jobs dataset connected to it. To this report, we are going to add a Column Header Band. Click on the Data Band ![]() and select the Column Header Band as in the example below:
and select the Column Header Band as in the example below:
The report design area will look something like the example below:
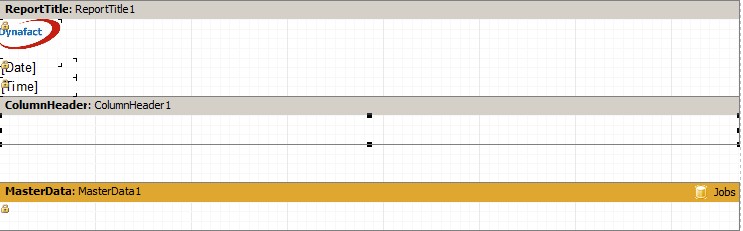
If the Column Header Band did not appear as in the example above, simply click on the Column Header Band and drag it above the Master Data Band.
We are going to add the following job data fields from the Data tab located on the right side of the windows. You can do this by clicking on the Jobs data field and dragging it to the report design area. After you drop the data field onto the report, you can change the size of the data field by grabbing the black squares of the data field with the mouse and resize the field. For example, the JobId field below shows the black squares where you can grab and resize the field:
![]()
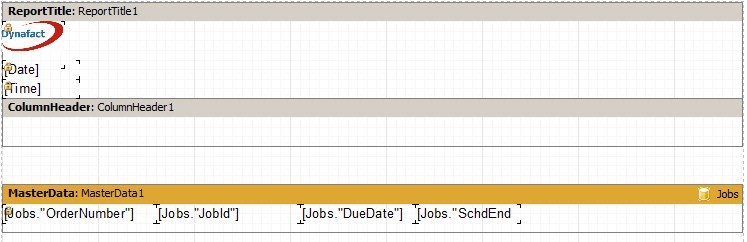
Drag the following job fields onto the Master Data Band and change the width of each field after you drop it as required:
When a field is highlighted (black squares appear) you can make minor adjustment and move the field by pressing and holding the Ctrl key and then pressing the keyboard cursor arrows. You can also highlight several fields to move at once by highlighting one field and then hold the Shift key down and highlight the other fields you want to move. You can then either move the group of fields by using your mouse, or press and hold the Ctrl key and use the cursor arrows.
Your report design area will appear similar to the example below:
We are now going to add headings for each column. Click on the Variables tab at the right side of the report. Drag and drop the following DMS Terms onto the Column Header Band:
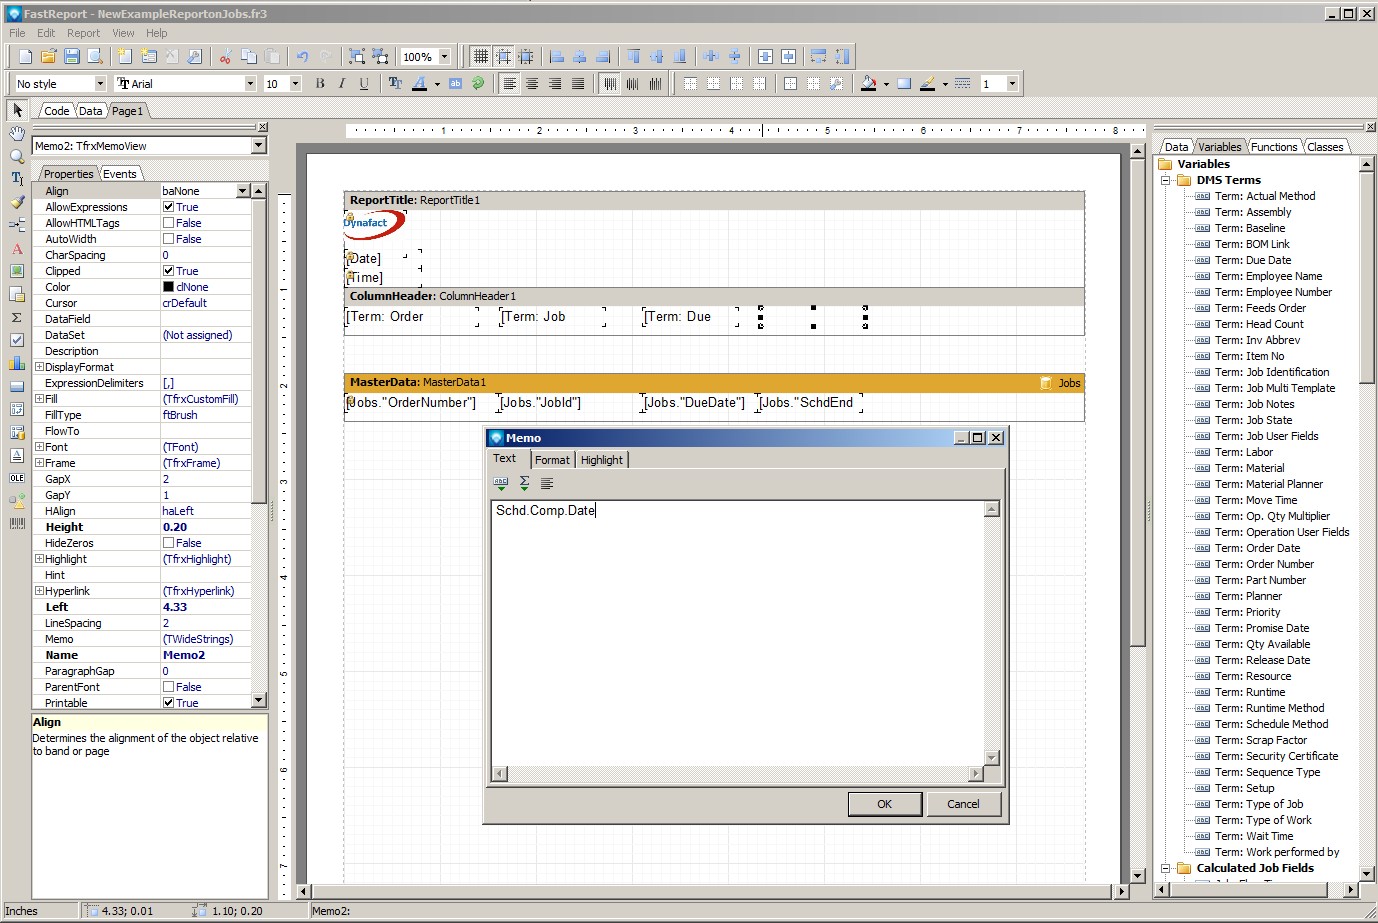
You will note there is not a term for SchdEndDate, so we are going to add a Text object and create our own title. To do this step, click on the text icon ![]() located on the vertical Designer Menu Bar at the left side of the window. Move your mouse to the Column Header Band and draw a text box, about the same size as the other fields, by using your right mouse button. A pop up window will appear where you enter the text for the text object. Enter "Schd.Comp.Date" as in the example below, and then press the OK button on the pop up window:
located on the vertical Designer Menu Bar at the left side of the window. Move your mouse to the Column Header Band and draw a text box, about the same size as the other fields, by using your right mouse button. A pop up window will appear where you enter the text for the text object. Enter "Schd.Comp.Date" as in the example below, and then press the OK button on the pop up window:
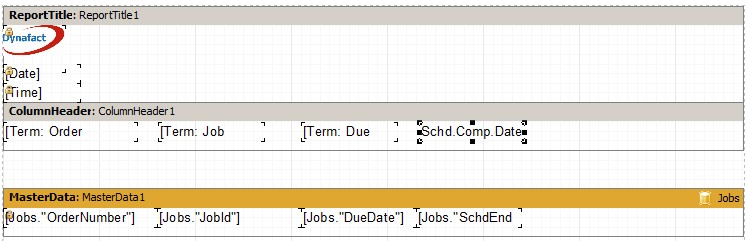
Your report design area will appear similar to the example below:
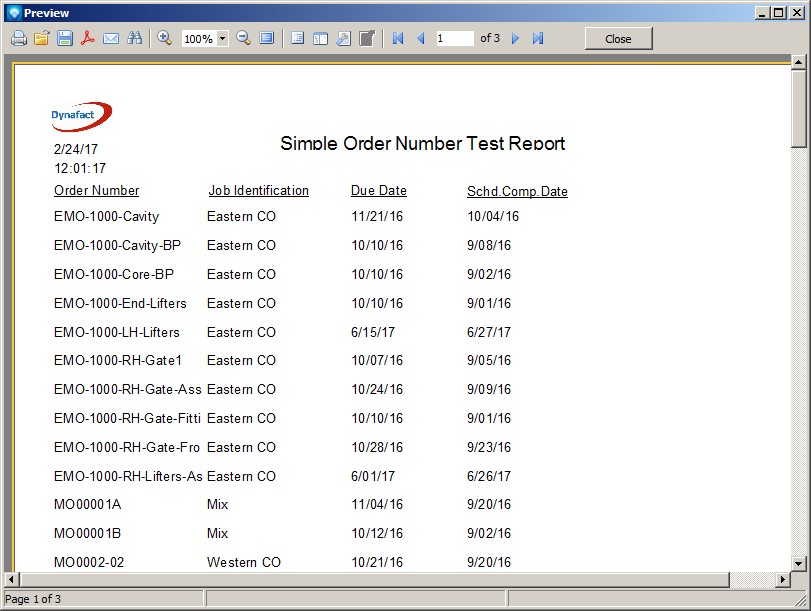
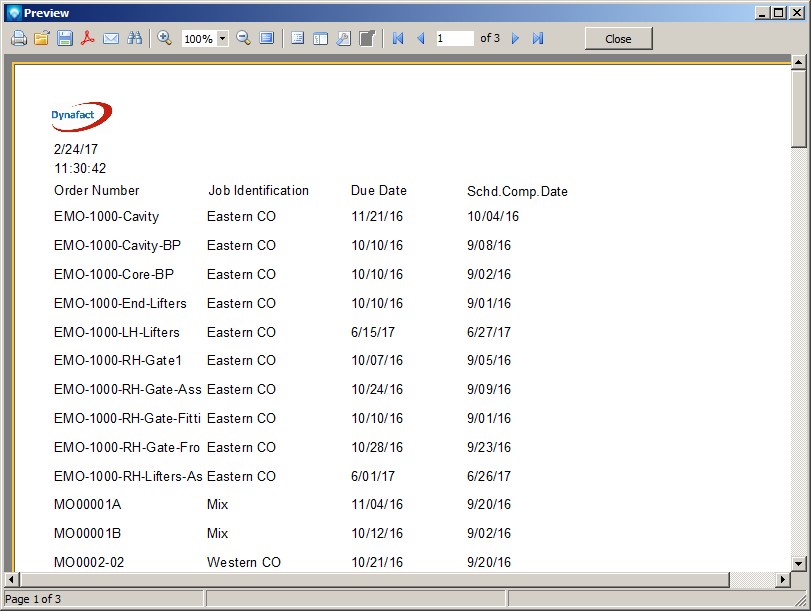
Save the report by clicking the save icon ![]() or by File | Save. Exit the report using File | Exit. You will be returned to the Mfg Orders Job Grid. Trying viewing your new report by using the View Report button. Your report will appear something similar to the example below. Note that while you are in the Report Designer you can press the F9 key to run the report. However, the report generated will not have any search filters and the report may take some time to complete. You can always cancel the report by clicking the Cancel button on the report preview window which appears at the top right side of the window:
or by File | Save. Exit the report using File | Exit. You will be returned to the Mfg Orders Job Grid. Trying viewing your new report by using the View Report button. Your report will appear something similar to the example below. Note that while you are in the Report Designer you can press the F9 key to run the report. However, the report generated will not have any search filters and the report may take some time to complete. You can always cancel the report by clicking the Cancel button on the report preview window which appears at the top right side of the window:
We are going to make two more enhancements to complete the report. From Mfg Orders Job grid, select the report and click on the Edit Report button. On the next window, select the Customize Report button and your report will appear in the DMS Report Designer.
First, let's add a single underline to the column headers. To do this, select all the column header fields by highlighting one field, press and hold the Shift key and then select the other fields. Now press the Underline icon ![]() located at the top of the Report Designer in the tool bars section. The window will appear similar to the example below:
located at the top of the Report Designer in the tool bars section. The window will appear similar to the example below:
The last step will be to add a report title. The Report Title Band is already on your report as it was inherited from the Base Report. (If it was not inherited from the Base Report, you can click on the Data Band ![]() and select the Report Title Band.) Click on the Report Title Band at the top of the design area in your report. Make sure that the Underline toggle is turned off by clicking
and select the Report Title Band.) Click on the Report Title Band at the top of the design area in your report. Make sure that the Underline toggle is turned off by clicking ![]() . (If you leave this toggled on, the title will be underlined. That is your choice.) Click on the text icon
. (If you leave this toggled on, the title will be underlined. That is your choice.) Click on the text icon ![]() located on the vertical Designer Menu Bar, and draw a text box object on the Report Title Band. The text box pop up will appear. We want the title to be "Simple Order Number Test Report", but we want the order number to be the DMS Term Order Number. To create this report title, enter "Simple " to the memo. Then press the icon at the top left side of the pop up
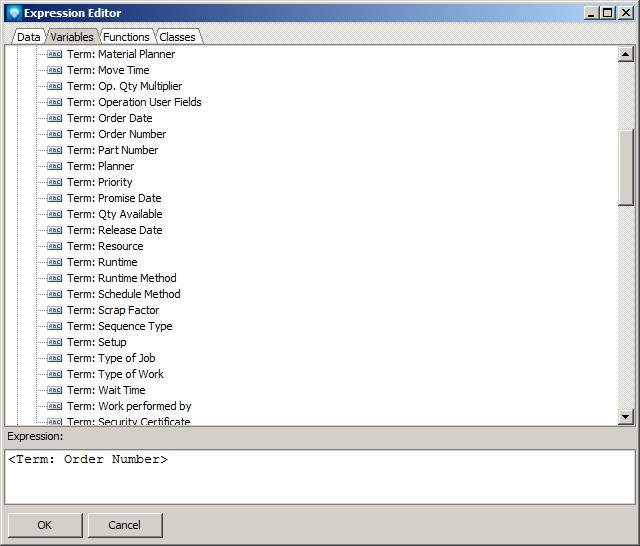
located on the vertical Designer Menu Bar, and draw a text box object on the Report Title Band. The text box pop up will appear. We want the title to be "Simple Order Number Test Report", but we want the order number to be the DMS Term Order Number. To create this report title, enter "Simple " to the memo. Then press the icon at the top left side of the pop up ![]() . A new window will appear called the Expression Editor. Click on the Variable tab and then double click the DMS term Order Number. The Expression Editor will appear as in the following example:
. A new window will appear called the Expression Editor. Click on the Variable tab and then double click the DMS term Order Number. The Expression Editor will appear as in the following example:
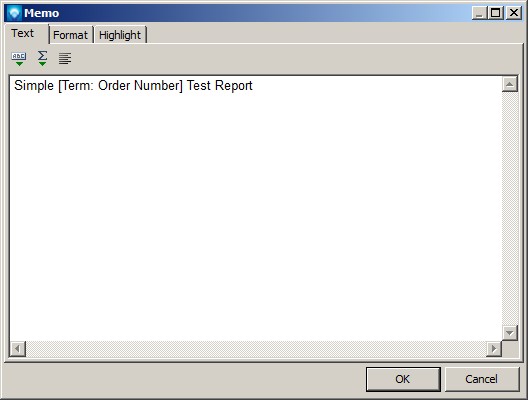
Click OK, and then continue to enter " Test Report". The pop up memo will appear similar to the example below:
Click OK. With the text object on the Report Title Band still highlighted, change the font size, located near the top of the Report Designer in the tool bars area, from 10 to 14. Resize the text object so the entire title can be seen. The Report Title Band will appear similar to:
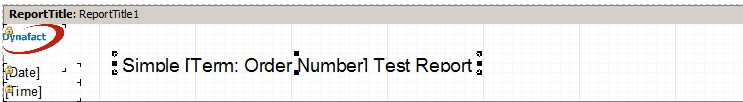
To center this title horizontally for the report, select the Center Horizontal in Band icon ![]() . To center this title vertically, select the Center Vertically in Band icon
. To center this title vertically, select the Center Vertically in Band icon ![]() . Save the report and trying viewing it. Your report will appear similar to the example below:
. Save the report and trying viewing it. Your report will appear similar to the example below: