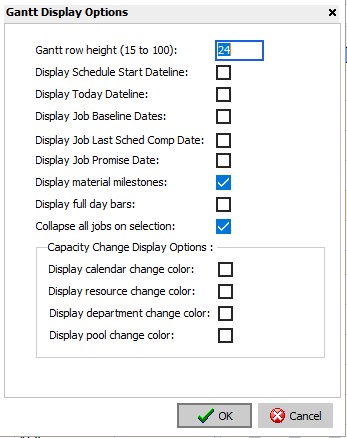
The Assembly Gantt Chart has the following options that are selected from the View | Gantt Display Options:
Gantt row height (15 to 100). This option enables you to select the height of each of the Gantt chart rows. Valid entries are from 15 to 100. The default is 35.
Display Schedule Start Dateline. If selected, the schedule start date will appear on the graph as a solid blue line with “Schedule Start” written vertically to the right side of the dateline.
Display Today Dateline. If selected, a dashed blue dateline will appear on the corresponding date column of the graph.
Display Job Baseline Dates. If selected, markers for the job baselines dates will appear showing the baseline start date and the baseline end date.
Display Job Last Schd Comp Date. If selected, the job’s last schedule completion date is display.
Display Job Promise Date. If selected, the Job Promise dates are displayed.
Display Material Milestones. If selected, the Material Milestones are displayed.
Display full day bars. If selected, the bar drawn takes up the entire length of the day. If not selected, the bar only takes up part of the day it ends on.
Collapse all jobs on selection. If selected, all the jobs' operations are not shown when the graph is displayed (Collapse All). If not selected, all the jobs' operations are shown when the graph is displayed (Expand All).
Display calendar change color. If selected, calendar changes will appear on the graph.
Display resource change color. If selected, resource changes will appear on the graph.
Display department change color. If selected, department changes will appear on the graph.
Display pool change color. If selected, pool changes will appear on the graph.