|
Resource Gantt Chart
|   |
|
Resource Gantt Chart
| |
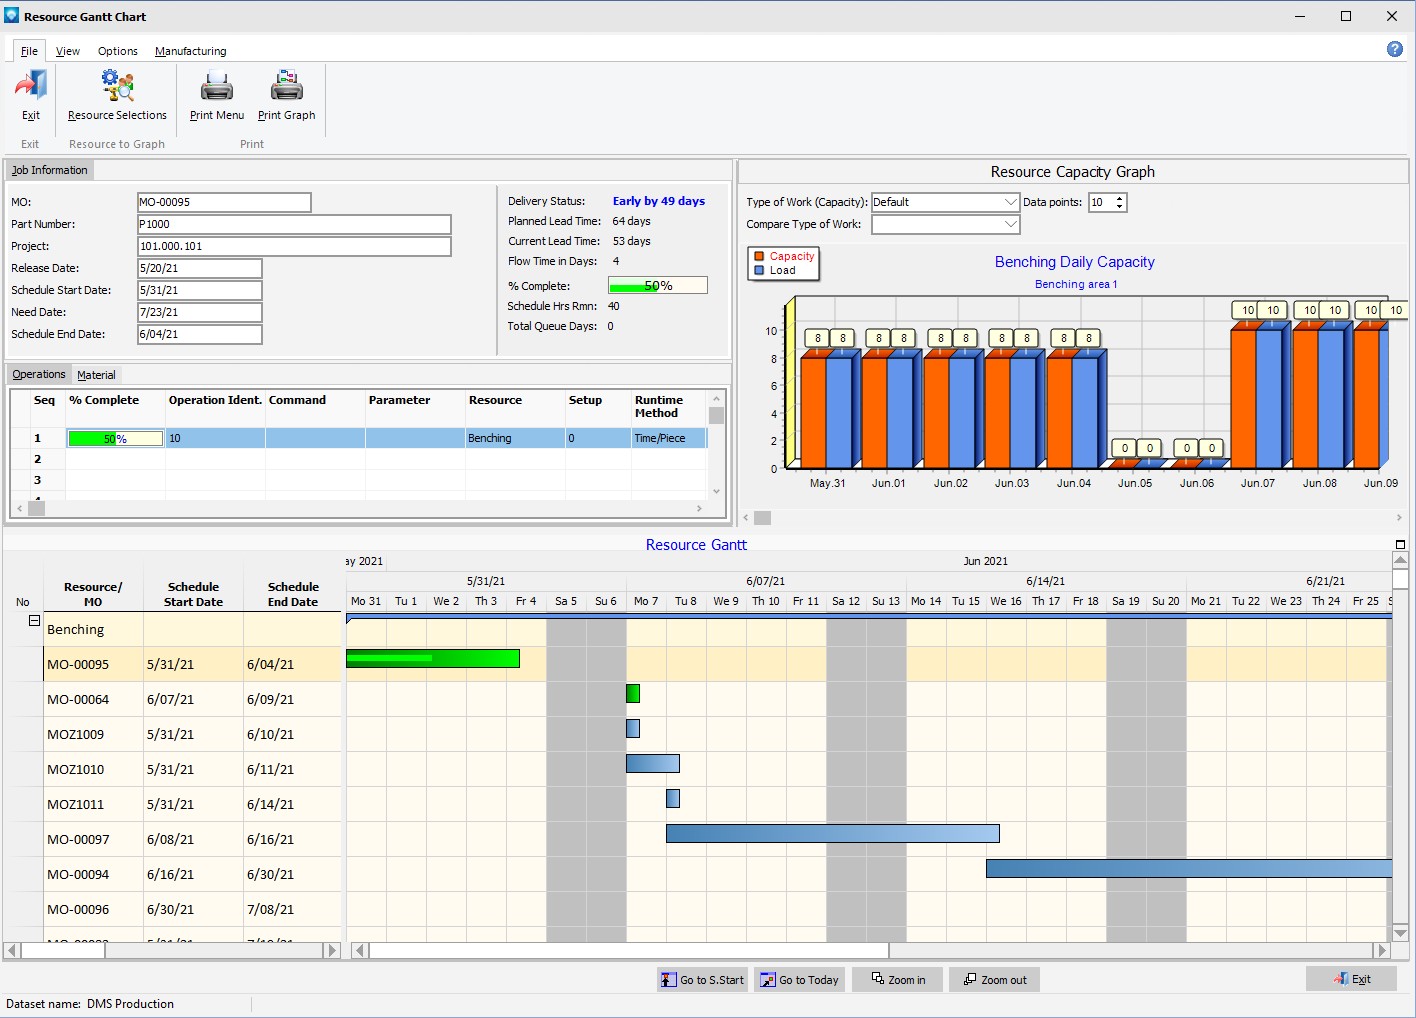
The Resource Gantt Chart displays the dispatch list for each resource from the current schedule start date out a given number of days. The job/operation highlighted in the resource Gantt is automatically displayed on the job panel at the top left and in the operation grid below the job panel. The operation highlighted in the Operation Grid has its resource capacity displayed at the top right.
When you first enter into the Resource Gantt, the resource selections window is displayed asking you the resources you want to graph. You can also select the resource to graph by using either File | Resource Selections.
After selecting the resources you want to graph, press OK to load the Gantt chart.

The following is an example of the Resource Gantt Chart. The Job Information, Resource Capacity Graph, and the operations grid can be resized by using the mouse on the splitter bars between each section. On the Gantt chart, green bars show in process operations and blue bars show scheduled operations:
You can resize the columns in the grids by positioning the mouse over the bar ![]() between the columns in the heading and drag the column to the desired with. If you hover the mouse cursor over a bar, details on the bar are displayed in a popup window. The Job Notes, Operation Notes and Material Notes can be displayed by double clicking on the notes cell in the grid. For more information, please see Displaying Notes.
between the columns in the heading and drag the column to the desired with. If you hover the mouse cursor over a bar, details on the bar are displayed in a popup window. The Job Notes, Operation Notes and Material Notes can be displayed by double clicking on the notes cell in the grid. For more information, please see Displaying Notes.
The following tabs and commands are available:
File
View
Options
Manufacturing
The following right click pop up menus are available:
Other commands are:
Note when changing to or from Shifts, selecting different sort orders, or selecting and entering a new number of dispatch days out, the Gantt chart must recalculate and load the data.