|
Report on Capacities Tutorial
|   |
|
Report on Capacities Tutorial
| |
In this tutorial we are going to create a new report based on the DMS Report Type Capacities.
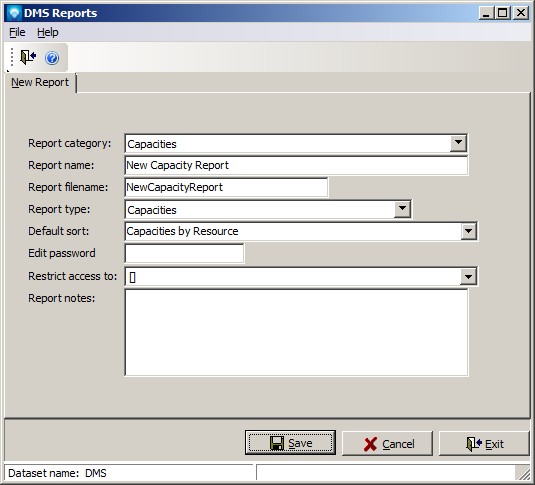
In Mfg Orders Job Grid, click on the New Report button. DMS will display the New Report window. Enter the information as per the example below (you can use the default Report filename):
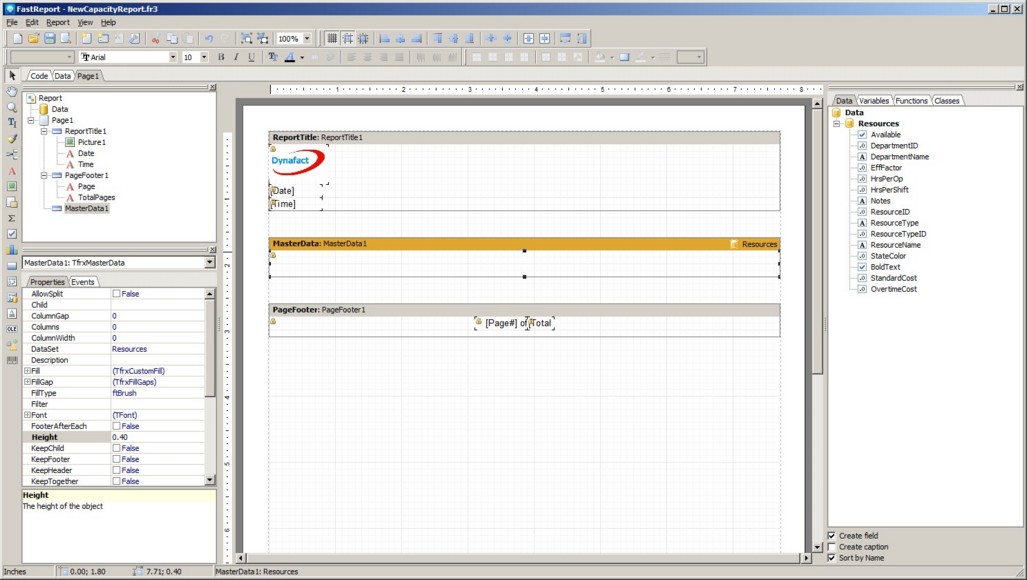
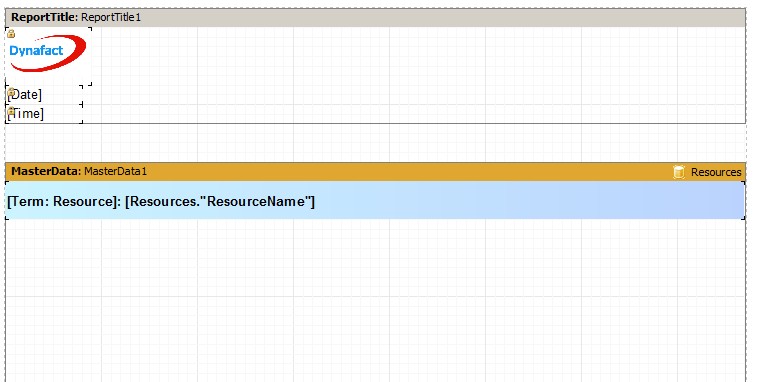
Click the Save button and the report designer will appear as in the example below:
Capacity reports use of the Calculated Capacity Variables to display capacity information for a resource. The three variables should be grouped together in order to display capacities correctly. The three Calculated Capacity Variables are:
Each time one of the above variables is used on the report, it is updated so that the next time it is used it shows the next value. For example, let's say that the date is March 1, 2017 and we are displaying capacities using a day time frame. The fist time you display Cap: Date, it will be shown as "March 1, 2017". the next time you use Cap: Date it will be shown as "March 2, 2017, and the third time "March 3, 2017", etc. Therefore, if you want to show the correct date, available capacity, and load, the three variables should always be used together in groups of three. As we write this report, this concept will become clearer.
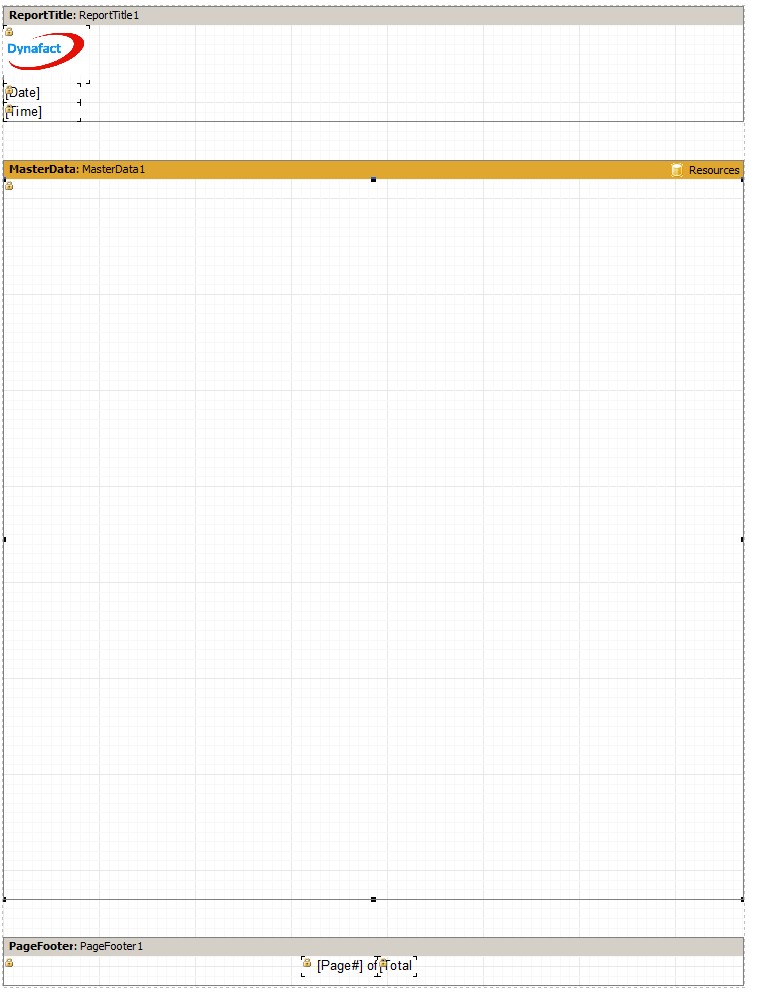
The report we are going to create will show the capacity of a resource on on page. The first step is to increase the Master Data Band size to take up the entire page as in the example below. Select the Master Data Band and drag the lower bar down to the bottom of the page:
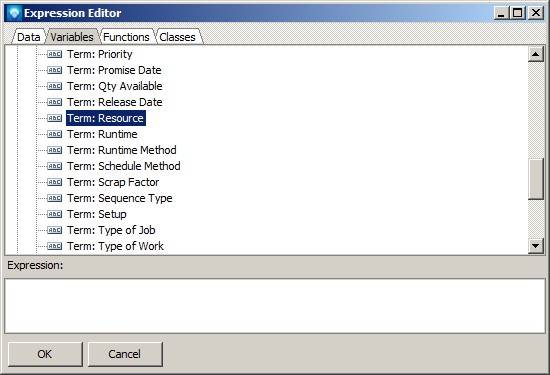
Add a Text Object to the top of the Master Data Band. Press the Insert Expression icon ![]() at the top left side of the pop up. A new window will appear called the Expression Editor. Click on the Variable tab and then double click the DMS Term Resource. The Expression Editor will appear as in the following example:
at the top left side of the pop up. A new window will appear called the Expression Editor. Click on the Variable tab and then double click the DMS Term Resource. The Expression Editor will appear as in the following example:
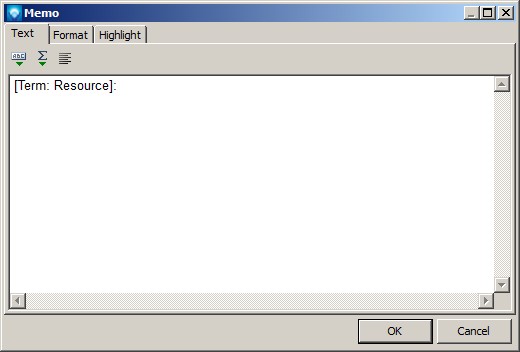
Click the OK button and the Memo editor appears. Add a colon : and a space after the colon to the end of the term as in the example below:
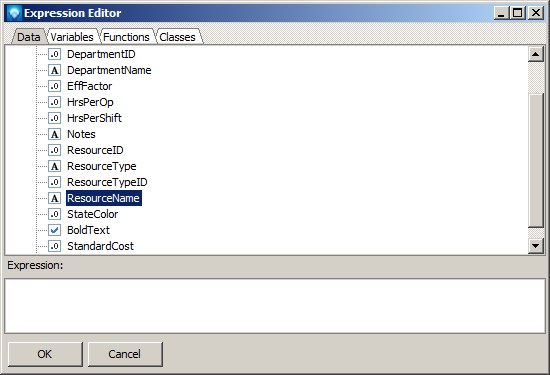
Again press the Insert Expression icon ![]() at the top left side of the pop up. A new window will appear called the Expression Editor. Click on the Data tab and then double click the ResourceName:
at the top left side of the pop up. A new window will appear called the Expression Editor. Click on the Data tab and then double click the ResourceName:
Click OK and the memo editor should appear as in the example below:

Click OK to save the information to the ext object.
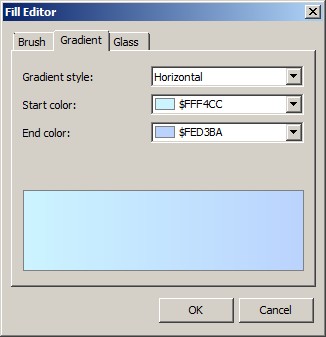
We are now going to add color to the text object. Select the text object we just added and click on the Fill property at the left side of the window. When the fill editor pops up, select the Gradient tab and select two color gradients as in the example below:
Click the OK button. Click on the bold button at the top of the window and center the text vertically. Also, stretch the text object so it is the full width of the Master Data Band. The report work area should appear similar to the example below:
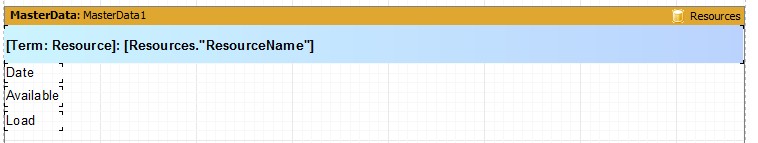
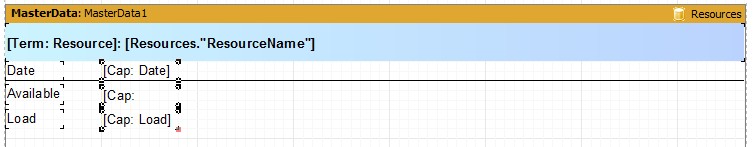
Add three text objects to the Master Date Band and enter the text:
Line the text objects as per the example below::
We are now going to add a line below the Date. Click on the draw icon ![]() on the left side of the window. Select Diagonal Line, move the mouse cursor under the title on the headings on the group header and draw a line similar to the example below:
on the left side of the window. Select Diagonal Line, move the mouse cursor under the title on the headings on the group header and draw a line similar to the example below:

The next steps are the more tedious part of building a capacity report. Recall that each time the three variables of data Date, Available, and Load are on the report, the report will display the date and that date's available capacity and load. Therefore, if we want to display a week of capacity we will need to repeat three variables 7 times, one for each day of the week.
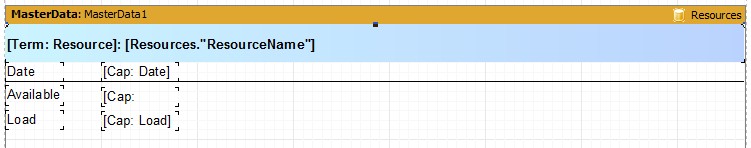
First, add the three variables from the Variables tree at the right side of the window:
Align the three variables as per the example below:
Before we copy and paste the variables on the report, we are going to format the numbers Cap: Available and Cap: Load. Click Cap: Available and and then while holding down the shift key, click on Cap: Load. With these two objects selected, click on the Display Format property and select the format as per the example below:
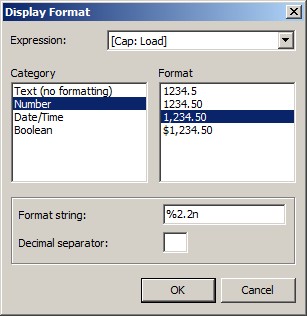
Click OK to save the format.
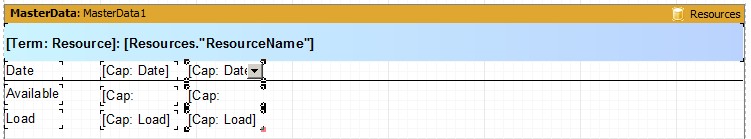
Now, select the Cap: Date variable on the report work area and then while holding down the shift key select the Cap: Available and Cap: Load. the Three variables will be highlights as in he example below:
Press the Ctrl key and the C key to copy the three selected variables onto the clipboard. Move the mouse cursor over to the right side of the three select variable and press Ctrl and the V key to paste the copied three variable. The three variables are not dropped on the Master Data Band until you press the mouse key. Align the variables and then press the left mouse key to drop them on the Master Data Band. The work area will appear similar to:
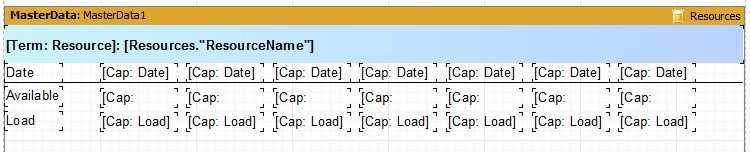
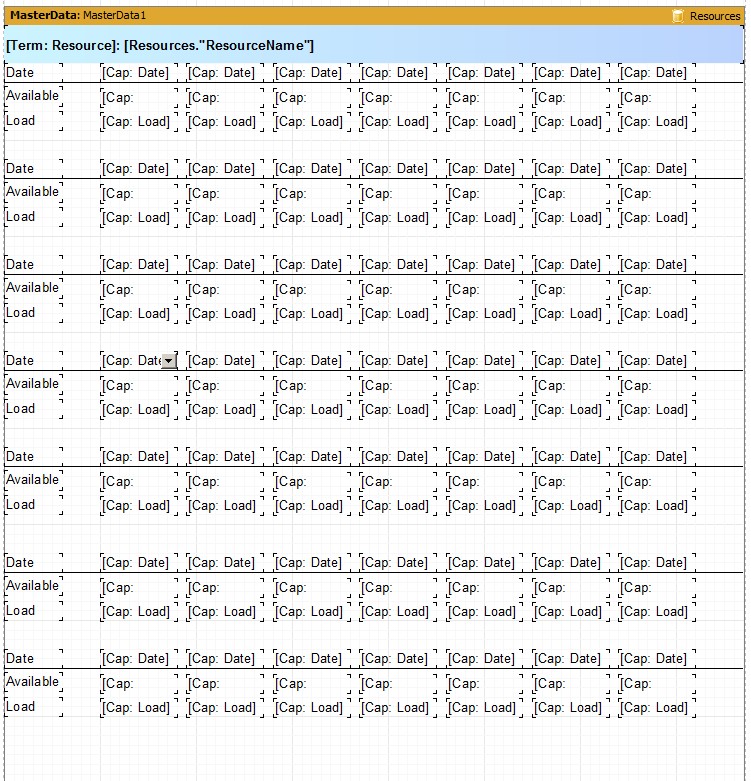
Continue to use the Ctrl key + V to paste the three variables on the Master Data Band until a total of seven groups appear as in the example below:
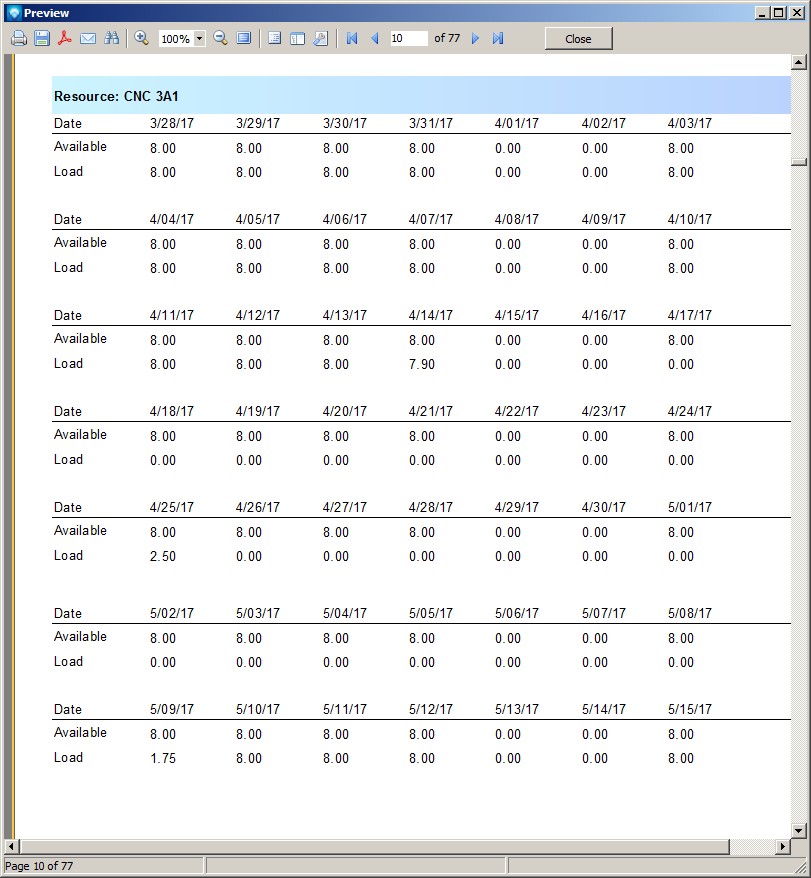
Save the report, exit out of the report designer, and return the Mfg Orders Job Grid. Try running the report using the View Report button.
After exiting the view, from Mfg Orders Job Grid, select the Edit Report button and then click on Customize to continue building the report.
For this example report, we want to have seven lines of data going down the page. We can use the same method above to copy and paste full lines of the report. Do to this, select all the objects across the one line of the report (i.e. the three text objects Date, Available, and Load, plus the seven group of three variables of Cap: Date, Cap: Available, Cap: Load, as well as the line that appears under the date. Your work area will appear as:
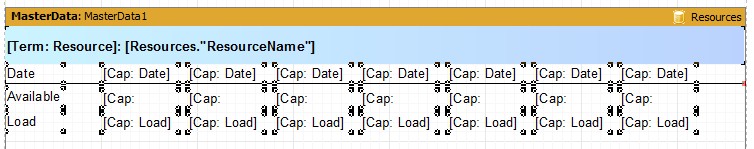
Press Ctrl and C to copy the line. Position your mouse cursor under the existing line, and then press Ctrl and V to paste the line. Align the data and press the left mouse button to paste the line onto the report. Move the mouse cur down to the next line, and paste the next line onto the report. Repeat this step until there are a total of seven lines on the report as in the example below:
Save the report and try viewing it. It should appear similar to: