|
Report on Dispatch Tutorial
|   |
|
Report on Dispatch Tutorial
| |
In this tutorial we are going to create a new report based on the DMS Report Type Dispatch. The rows of the dispatch report will have alternating colors for ease of reading.
In Mfg Orders Job Grid, click on the New Report button.
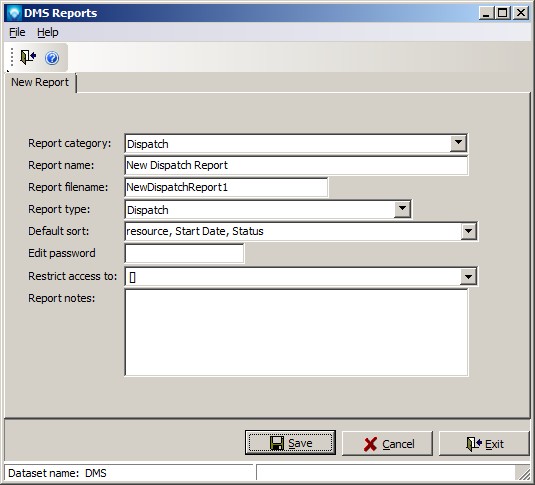
DMS will display the New Report window. Enter the information as per the example below (you can use the default Report filename):
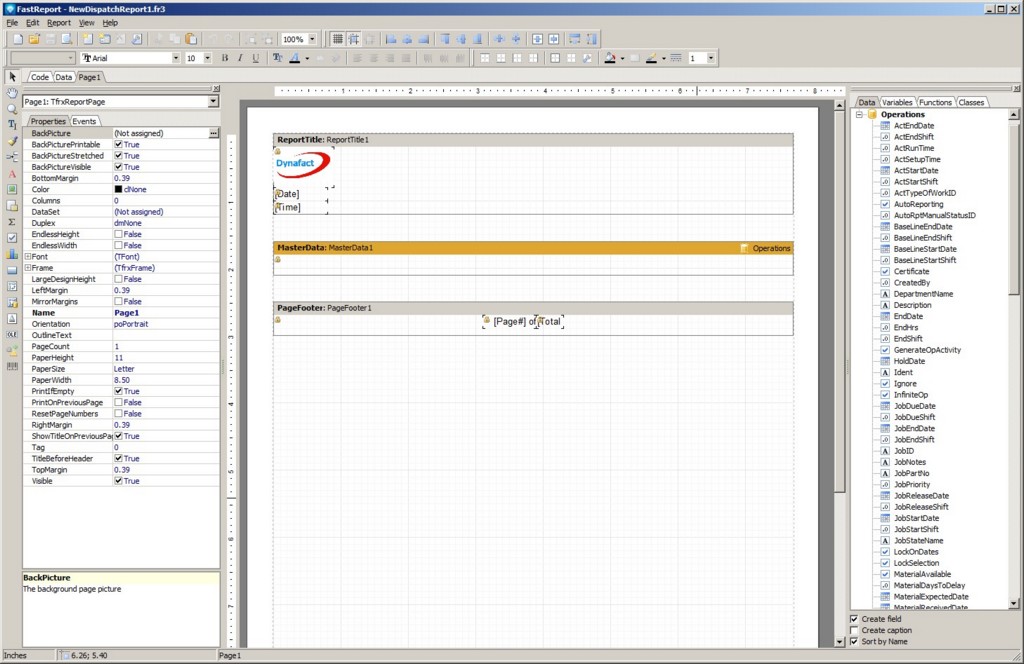
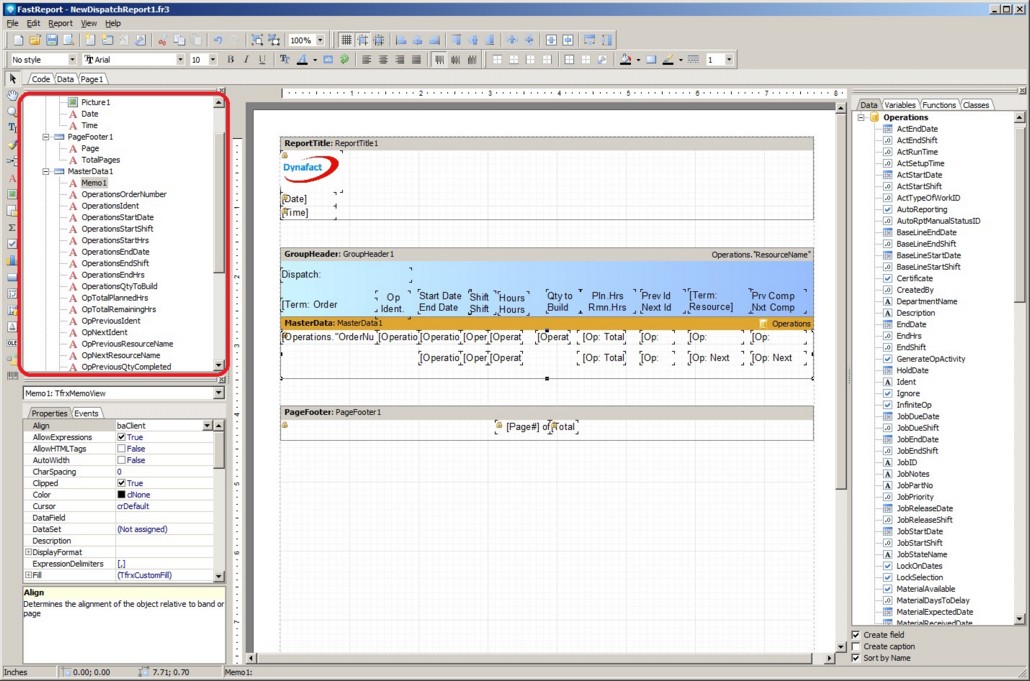
Click the Save button and the DMS Report Designer appears with information inherited from the Dispatch Base report:
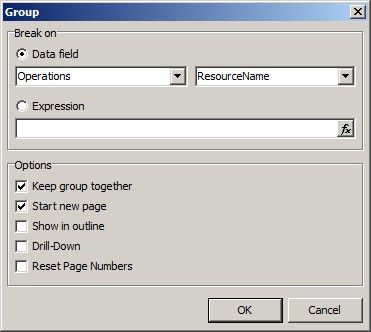
For the dispatch report, we want to group the report by resource name. Click on the Data Band ![]() on the Designer Menu Bar and select the Group Header. You will get a popup window similar to the example below. For the Data Field, Operations will be automatically populated. In the second drop down menu, select ResourceName as we will be grouping on the resource name. Select the check box "Keep group together" so that the group information will be kept together, and select "Start a new page" so that each new resource starts on a new page. Click OK:
on the Designer Menu Bar and select the Group Header. You will get a popup window similar to the example below. For the Data Field, Operations will be automatically populated. In the second drop down menu, select ResourceName as we will be grouping on the resource name. Select the check box "Keep group together" so that the group information will be kept together, and select "Start a new page" so that each new resource starts on a new page. Click OK:
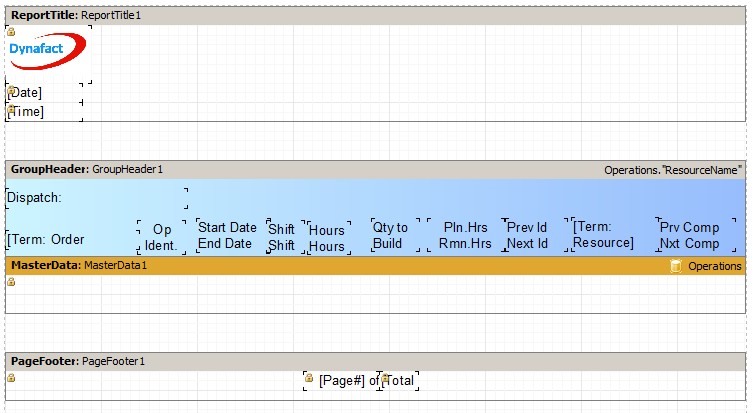
To the Group Header, add the Data field ResourceName to the left side of the Group Header band. Double click on the ResourceName text object you just added and add the work "Dispatch: " to the text as in: Dispatch: [Operations."ResourceName"]. You report work area will appear something like:
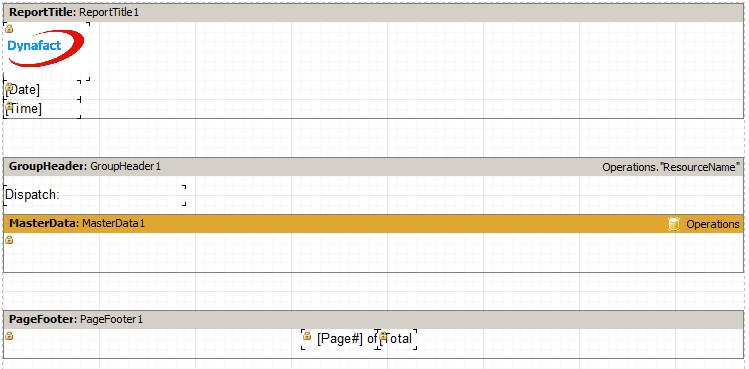
In the example above, the height of the group header has been increased for better formatting. You may wish to do the same for your report.
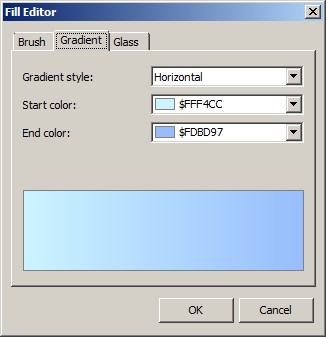
We are now going to add some color to the Group Header. Click on the Group Header. Under the Properties section on the left side of the Report Designer, locate and click on the Fill property and click on ![]() next to the property. A popup Fill Editor will appear. Select the tab Gradient as we are going to add a gradient color. Select a start color and an end color similar to the example below. Note that an example will be shown for the select gradient colors:
next to the property. A popup Fill Editor will appear. Select the tab Gradient as we are going to add a gradient color. Select a start color and an end color similar to the example below. Note that an example will be shown for the select gradient colors:
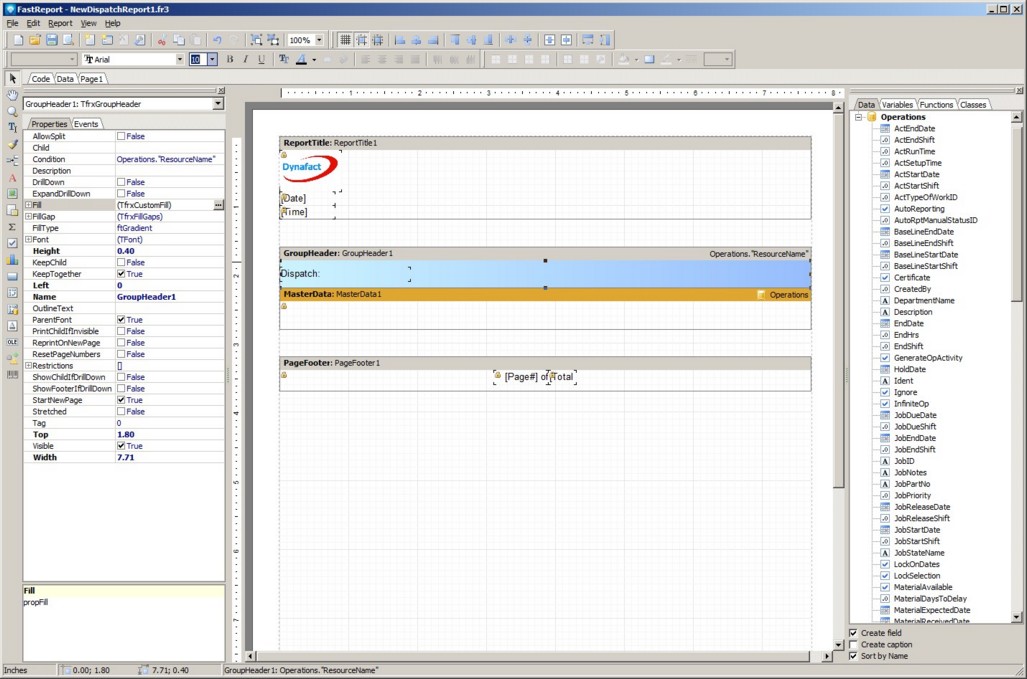
Click OK. Your window will appear similar to the example below:
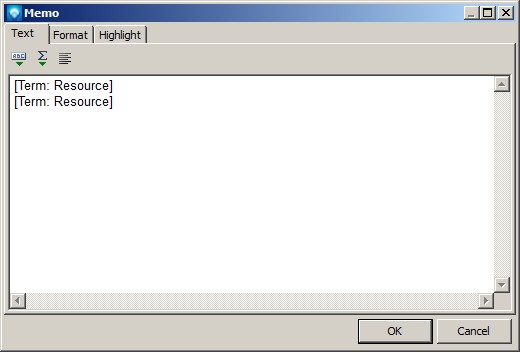
We are now going to add column titles for the Master Header band. First, make the Group Header height a size of about .080 (you can see the Height of the group header in the properties window when the Group Header is selected). This will give us room to add the column headings to the Group Header. Add the following headers to the Group Header:
You report work area will appear similar to the example below:
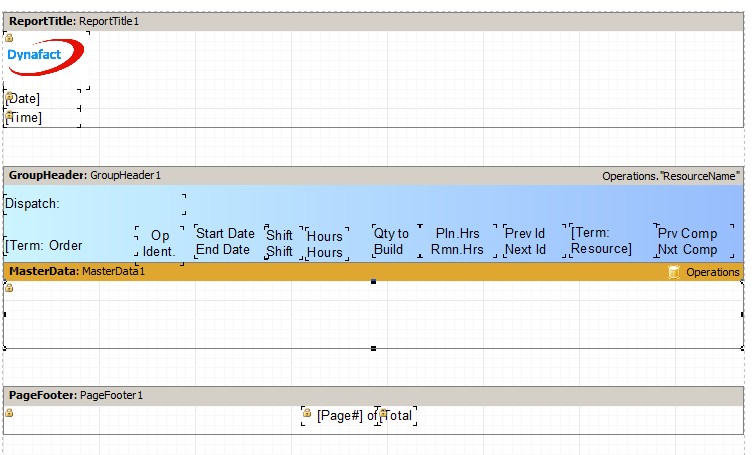
Before adding any data fields to the Master Data Band, we are going to add a text object so that we can color alternate rows. Place a text box on top of the Master Data Band and do not add any text to the popup window. Click OK. With the text box still highlighted, locate the Align property at the very top of the Properties list. Change setting to baClient". Your report work area will appear similar to the example below:
On top of the text object on the Master Data Band, add the following data fields under the corresponding report columns:
Save the report and try running the report. You may need to exit out of the Edit and select the View Report button to sort the report in the correct order.
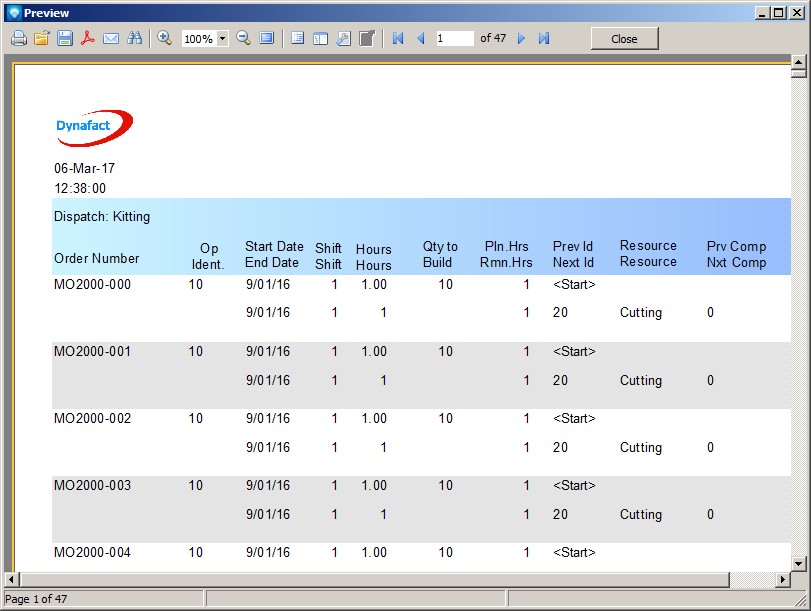
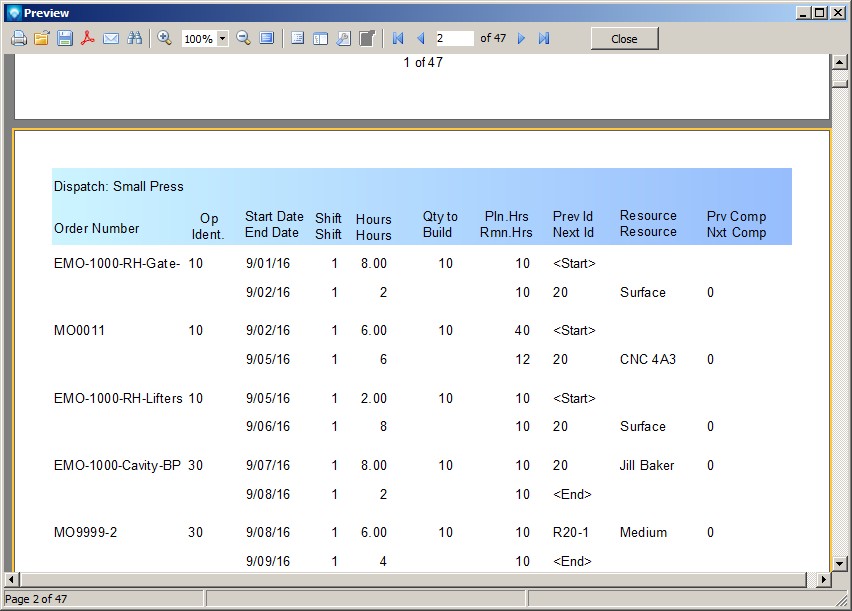
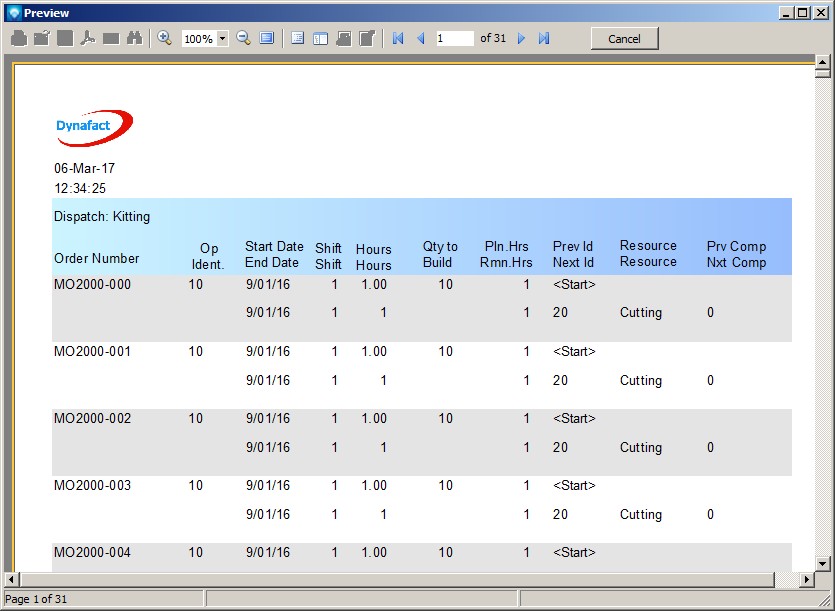
You should get a report similar to:
If you exited the report designer to view the report, enter back into the report designer using the Edit Report button. The last step will be to color the alternating rows of this report. Click on the text object that was placed on the Master Data Band. Note that you should not click on one of the data objects on the text object, but the text object itself.
Hint: You can see all the object on your report by selecting the View | Toolbars | Report Tree. If you select this toolbar view, a report tree of object will appear at the top left side of the designer as in the example below. You can use the Report Tree to select any object on the report. In this example, the Memo1 object has been selected:
Click on the High Light editor icon ![]() located at the top of the Report Designer. the highlight Editor will appear. Click on the Add button and the Expression Editor will appear. Enter the Expression <line> mod 2 = 1 as in the example below.
located at the top of the Report Designer. the highlight Editor will appear. Click on the Add button and the Expression Editor will appear. Enter the Expression <line> mod 2 = 1 as in the example below.
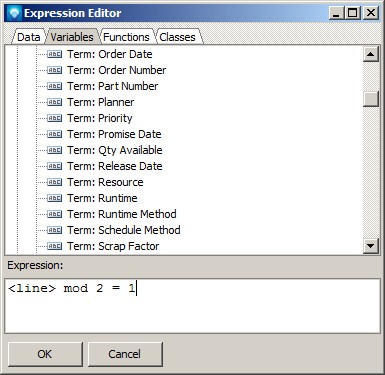
This expression tells the report engine that when the remainder of the line number divided by 2 equals 1, the expression will be true. Click OK to save the expression.
Click the Fill button and select a background color. A light color is suggested so the black text will be easy to read. The example below shows that a light gray color was selected:
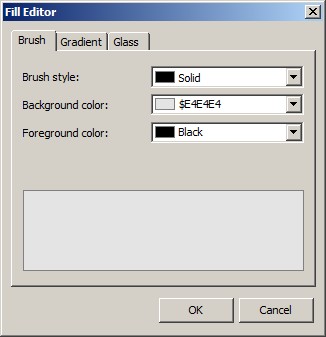
Click the OK button. In the Highlight Editor uncheck the font prompt as we are not going to change the font or color when the expression is true. Click OK to save the Highlight Editor changes. Save the report and try running it. You should see alternate row coloring as in the example below:
To this report you may wish to add a report title by adding a text box to the Report Title Band at the top of the report. You can also try changing the column headings to a bold font as well as other format setting.
If you wanted the first line under the title to be not be colored and then alternate color lines after that, change expression in the Highlight Editor for the text object on the Master Data Band to be <line> mod 2 <> 1. Your report will then appear as: