|
Capacity Pie Chart
|   |
|
Capacity Pie Chart
| |
The Capacity Pie Chart is displayed when you click on a bar in the Capacity Graph.
The example below shows the pop up pie chart after right clicking on a bar in the Capacity Graph. By using the buttons at the bottom of the window, you can:
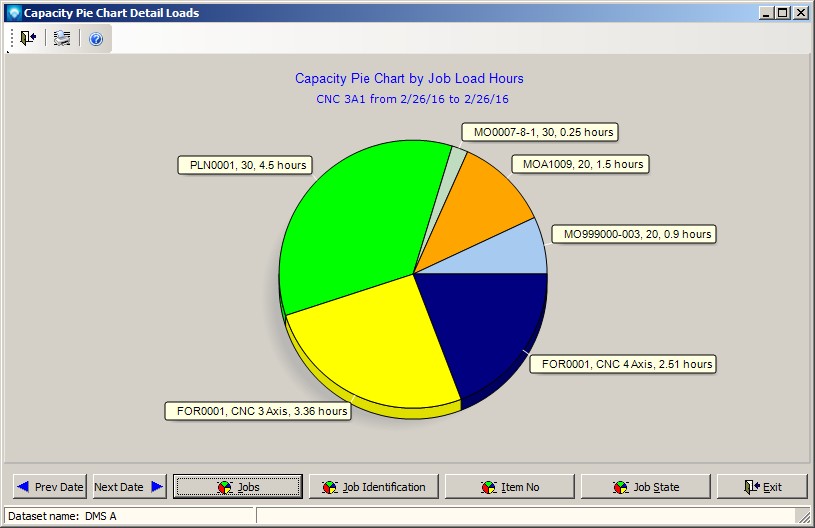
The pie chart can be rotated left or right by clicking on the pie chart background using the left and right mouse keys. You can also print the pie chart by using the print button ![]() .
.