|
Report on Jobs using Group Header Tutorial
|   |
|
Report on Jobs using Group Header Tutorial
| |
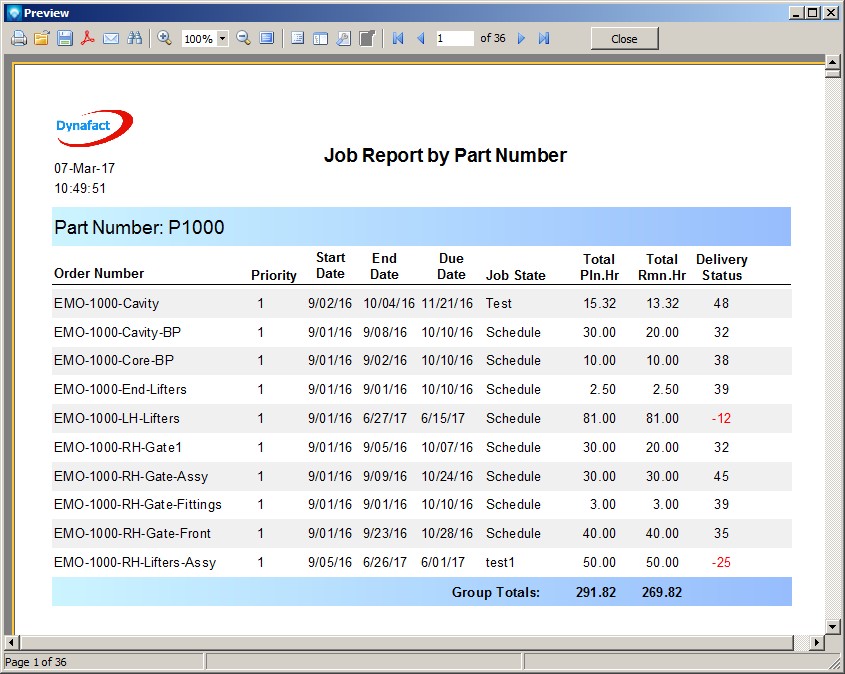
In this tutorial we are going to create a new report based on the DMS Report Type Jobs. The rows of the report will have alternating colors for ease of reading. The report will be grouped by Part Number with planned and remaining time per job totaled at the bottom of each group.
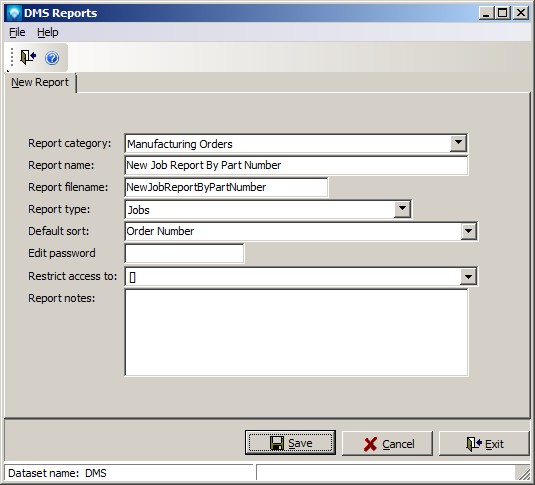
In Mfg Orders Job Grid, click on the New Report button.
DMS will display the New Report window. Enter the information as per the example below (you can use the default Report filename):
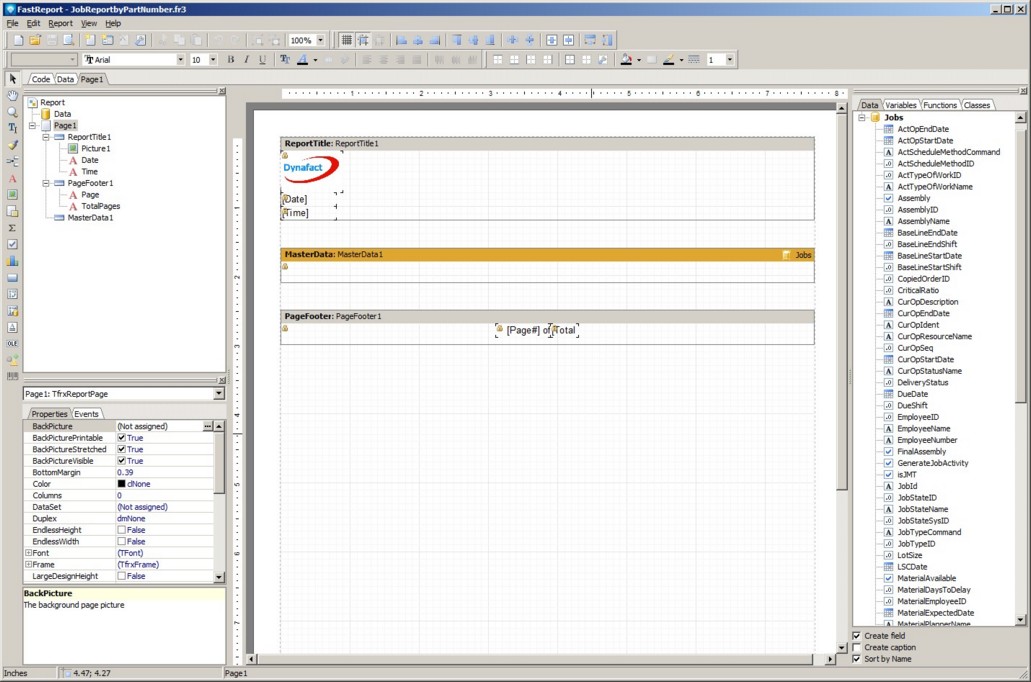
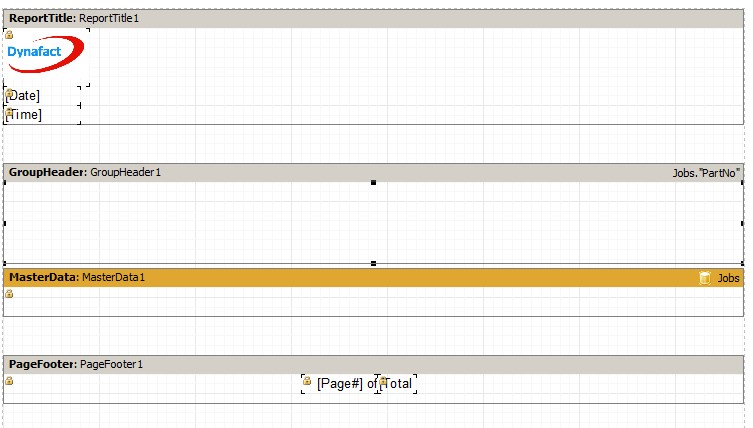
Click the Save button and the DMS Report Designer appears with information inherited from the Dispatch Base report. Note that in the example below the Report Tree is displayed at the top left side of the designer. This tree is turned on or off using View | Toolbars | Report Tree:
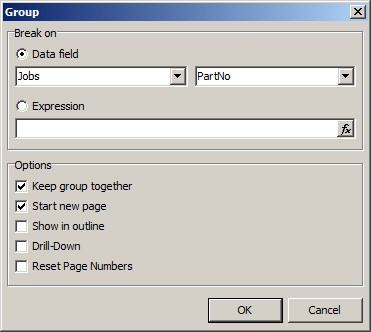
For the report, we want to group the report by Part Number. Click on the Data Band ![]() on the Designer Menu Bar and select the Group Header. You will get a popup window similar to the example below. For the Data Field, Jobs will be automatically populated. In the second drop down menu, select PartNo. Select the check box "Keep group together" so that the group information will be kept together, and select "Start a new page" so that each new part number will start on a new page. Click OK:
on the Designer Menu Bar and select the Group Header. You will get a popup window similar to the example below. For the Data Field, Jobs will be automatically populated. In the second drop down menu, select PartNo. Select the check box "Keep group together" so that the group information will be kept together, and select "Start a new page" so that each new part number will start on a new page. Click OK:
Click on the Group Header Band to select it, locate the property "Height" in the properties section on the left side of the window and set the Group Header height to .85. Drag the Group Header Band to be above the Master Data Band. You report work area will appear something like:
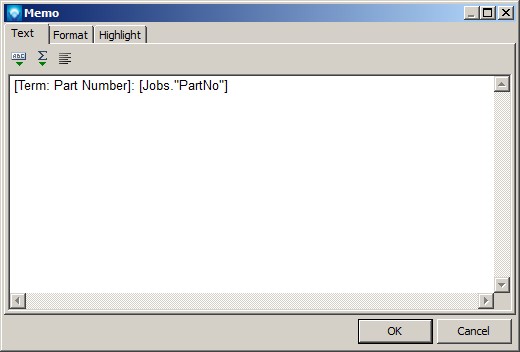
We are now going to add a title to the Group Header. Add a text object to the Group Header Band and stretch it to be the same width as the Group Header (hint: you can click on the Group Header and see what its width is, then click on the text object and set its Width property to the same width as the Group Header). In the popup Memo window, click on the icon ![]() and the Expression Editor will popup. Click the Variables tab, double click on the Term Part Number, and click OK to add the term to the Memo popup. Click on the icon
and the Expression Editor will popup. Click the Variables tab, double click on the Term Part Number, and click OK to add the term to the Memo popup. Click on the icon ![]() again to popup the Expression Editor, double click on the data field PartNo, and click OK. The Memo popup will appear as:
again to popup the Expression Editor, double click on the data field PartNo, and click OK. The Memo popup will appear as:
Click OK to save the text object.
We are now going to change the font size and color for this text object on the Group Header. With the text object selected, change the font at the top left side of the Report Designer to 14.
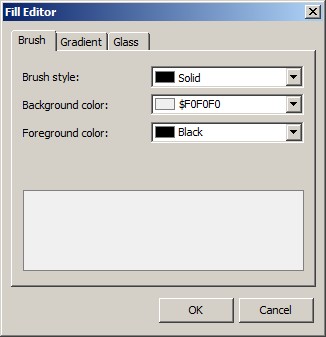
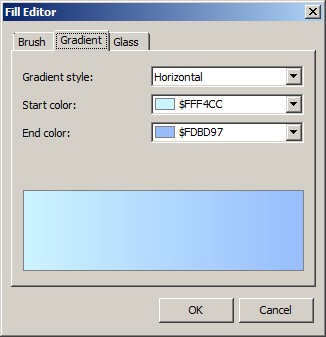
Under the Properties section on the left side of the Report Designer, locate and click on the Fill property and click on ![]() next to the property. The popup Fill Editor will appear. Select the tab Gradient as we are going to add a gradient color. Select a start color and an end color. Similar to the example below. Note that an example will be shown for the select gradient colors:
next to the property. The popup Fill Editor will appear. Select the tab Gradient as we are going to add a gradient color. Select a start color and an end color. Similar to the example below. Note that an example will be shown for the select gradient colors:

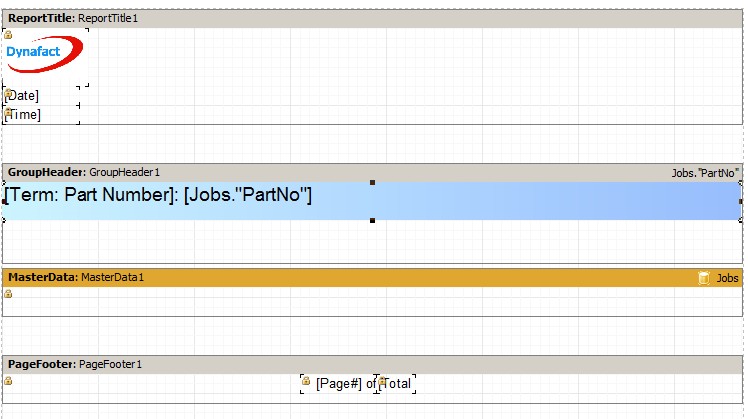
Click OK. The report work area will appear similar to the example below:
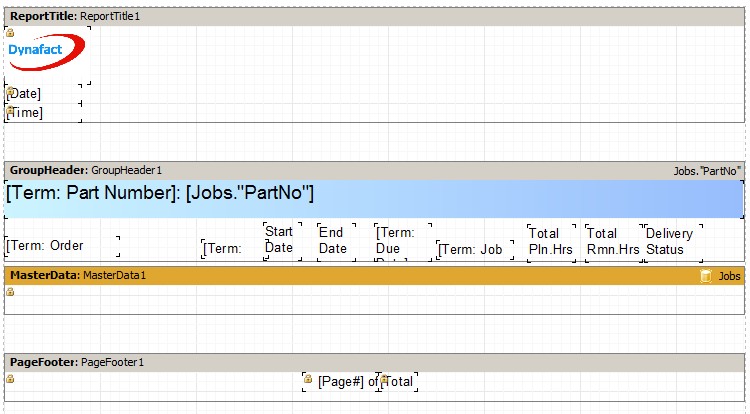
Click on the Group Header and make sure the font back to 10 (if not, set it to 10). Add following column headings to Group Header Band:
Your report work area will be similar to the example below. Save the report.
We are now going to add a text object to the Master Data Band that will be used to alternate row color. Add a text object to Master Data and then set property Align to be baClient. This aligns the text box to the entire Master Data Band:

We are now going to add data fields on top of text object on Master Data Band. From the Data tree at the right side of the designer drag and drop the following fields under the column headings:
From the Variables tree add the following fields under their column headings:
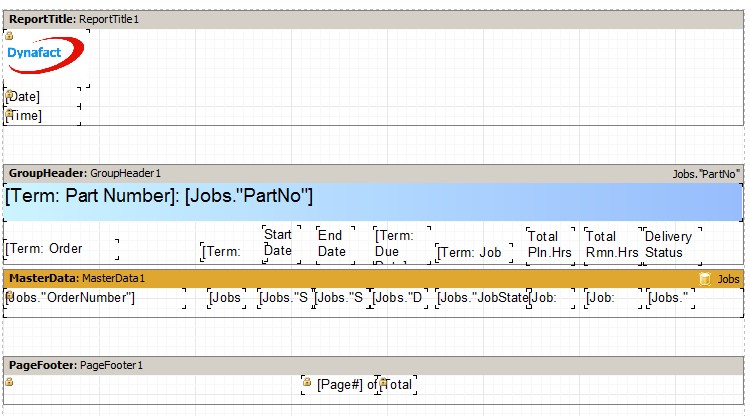
Your report work area will appear as in the example below:
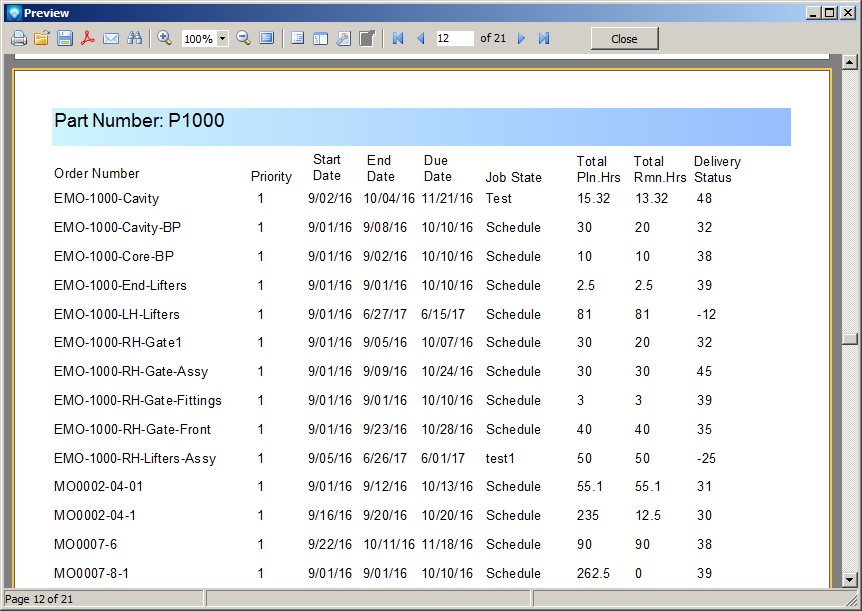
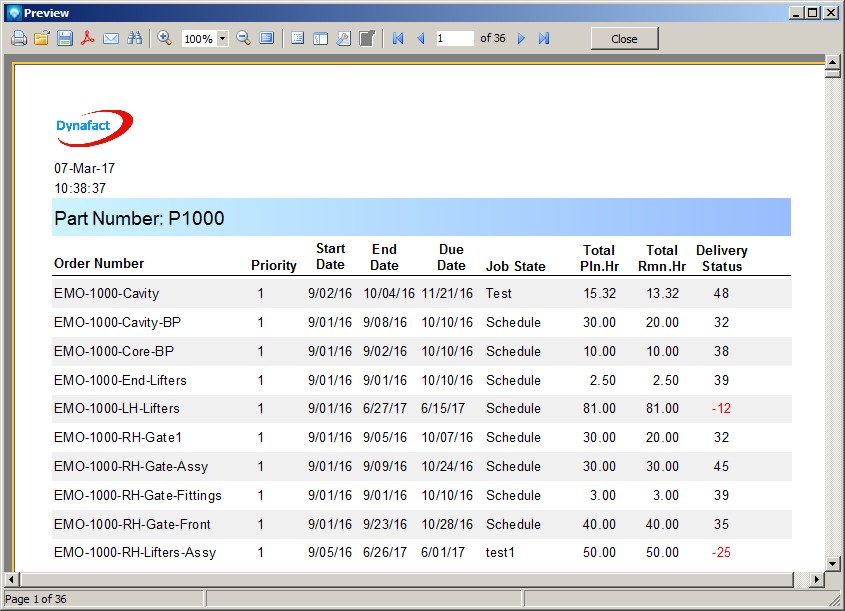
Save and try a test run. You may need to exit out and use the View Report button to view the report sorted in the correct order:
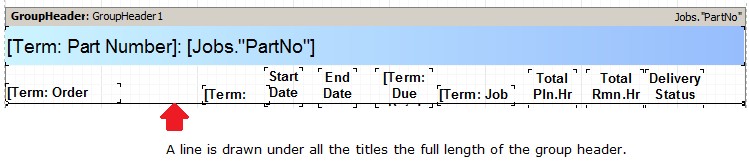
Using Edit Report, we are now going to add a line under all the titles. Click on the draw icon ![]() on the left side of the window. Select Diagonal Line, move the mouse cursor under the title on the headings on the group header and draw a line similar to the example below:
on the left side of the window. Select Diagonal Line, move the mouse cursor under the title on the headings on the group header and draw a line similar to the example below:
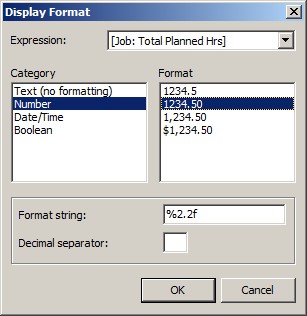
Select the TotalPlannedHrs data on the Master Data Band. Click on the property Display Format and select the format as in the example below:
Click OK to save the Display Format. Repeat the steps for the JobTotalRemainingHrs.
Select the data fields TotalPlannedHrs, JobTotalRemainingHrs and DeliveryStratus by clicking on the first field then holding down the shift key and clicking on the two other fields. Click on right justify icon ![]() to right justify these fields.
to right justify these fields.
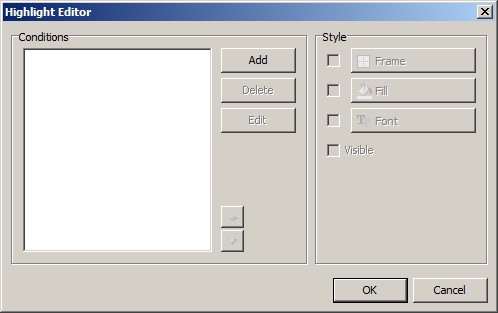
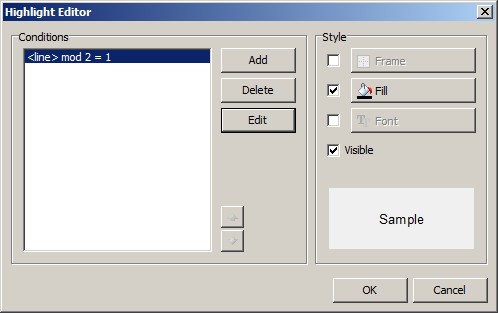
The next step is to add a highlight condition to delivery status. What we want to do is display the delivery status in red if it is negative, which indicates a late job. Click on the data variable DeliveryStatus and then at the top of the designer window select the Highlight Editor using the icon ![]() . The following popup window will appear:
. The following popup window will appear:
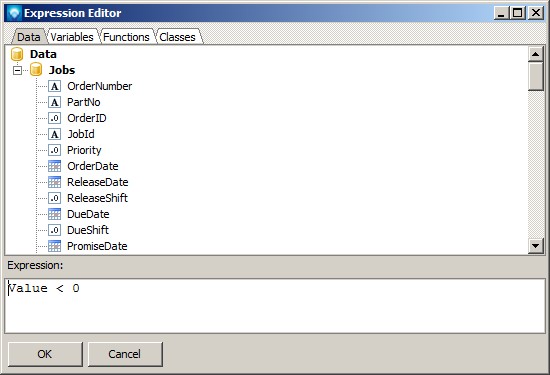
Select the Add button and the Expression Editor. The Expression will default to "Value < 0" which means that if the data value highlighted, Delivery Status in this case, is less than 0 the expression will be true. You can change this expression to represent what condition you want and you can also add multiple expressions by using the Add button, once for each new expression. In this case we want the condition to be true if negative so all we have to do is click the OK button:
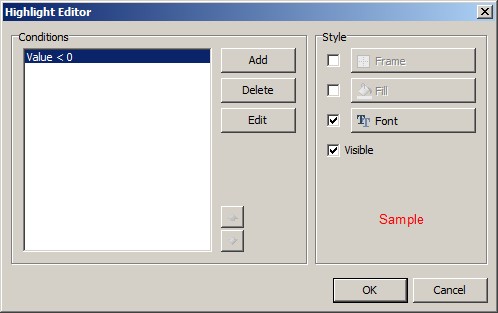
You will be returned to the Highlight Editor. Uncheck the Fill check box as we do not want any background fill for the Delivery Status field. You can change the font if you want (make it bold, italics, change color, etc), but it will default to red which is what we want in this example. Note that the Visible check box will make the data field invisible if you uncheck it and the condition is true. Leave this selection checked
The Highlight Editor will appear as:
Click OK to save the changes.
Save your report and try running it. You will probably have to make some editing changes like aligning data fields, title, column headings, etc. Make changes as you see fit to align your report.
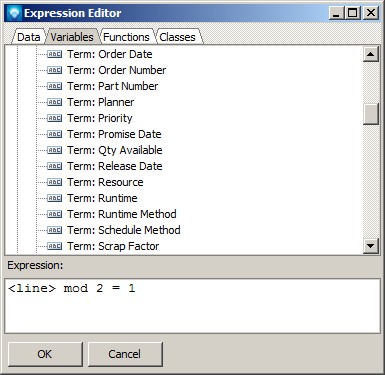
We are now going to color alternate lines in the report. To do this step, select the text box that is aligned with the Master Data Band that we added earlier in this tutorial. (This is the text box that we added all the data fields on top of in the Master Data Band.) Click on the Highlight Editor and select the Add button. the Expression Editor will appear. Add the expression <line> mod 2 = 1. What this says is if the line number divided by 2 has a remainder of 1, the expression is true. Therefore, every other line will be true. The Expression Editor will appear as:
Click the OK button to save the expression.
You will be returned back to the Highlight Editor. Click on the Fill button. The Fill Editor will appear. Select a background color like a light gray color similar to the example below. Click OK.
Back in the Highlight Editor, uncheck the Font check box as we do not want to change the font on alternating line. Your window will appear as:
Click the OK button to save the Highlight Editor changes.
Select all the headings in the Group Header and click on the bold Bold icon ![]() to toggle the headings all to bold.
to toggle the headings all to bold.
Save your report and try running it. It will appear as:
The final step will be to add a group footer to the report to sum the total planned hours and the total remaining hours. Add a Group Footer Data Band to the report using the icon ![]() for Report Bands menu. Click on the Fill property for the Group Footer and the following popup Fill Editor will appear. Select the Gradient tab and enter a start and end color similar to the example below:
for Report Bands menu. Click on the Fill property for the Group Footer and the following popup Fill Editor will appear. Select the Gradient tab and enter a start and end color similar to the example below:
Click OK to save the gradient color.
Add a text object on the Group Footer under the Planed Hours column. The Memo popup will appear. Click on the Insert Aggregate ![]() icon and the Insert Aggregate popup will appear:
icon and the Insert Aggregate popup will appear:
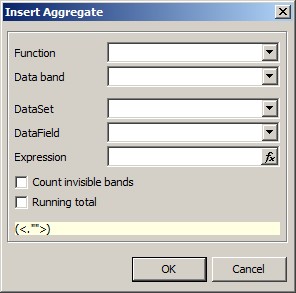
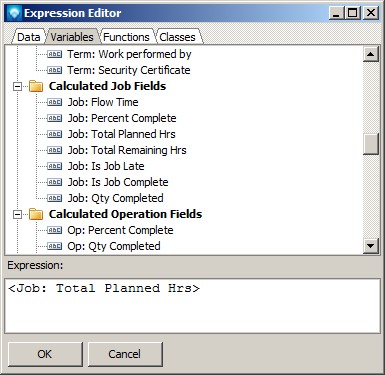
Select the Function SUM, the Data band Masterdata1, the DataSet Jobs will be populated, and then click on the Expression icon ![]() . The Expression editor will appear. From the Variable tab, select the Total Planned Hrs as in the example below:
. The Expression editor will appear. From the Variable tab, select the Total Planned Hrs as in the example below:
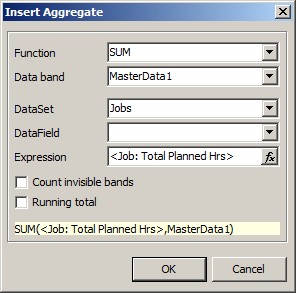
Click OK. The Insert Aggregate popup will appear as:
Click OK to save the function. The Memo editor will appear as:
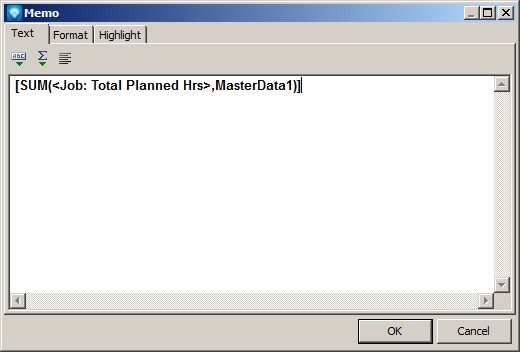
Click OK to save the text object.
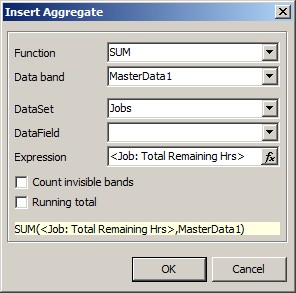
Add another text object under the Total Remaining Hours column. Click on the Insert Aggregate ![]() icon and similar to the steps above, add a SUM for the total remaining hours. the popup will appears as:
icon and similar to the steps above, add a SUM for the total remaining hours. the popup will appears as:
Click OK to save the expression and the Memo editor will appear as:
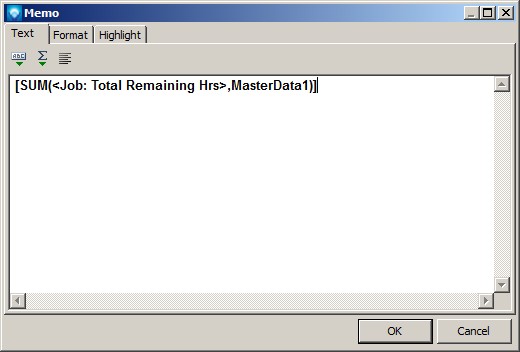
Click OK to save the text object.
Add a text object to the Group Footer called "Group Totals:". the text object will be positioned to the left of the other two text objects on the Group Footer.
Finally, add report title by adding a text object to the text object to the Report Title Band at the top of the report. Enter any report name you want, such as "Job Report by Part Number". Change the font to 14, bold the text, and center the title.
Save your report. It should appear similar to the report example below: