Capacity Grid |
|
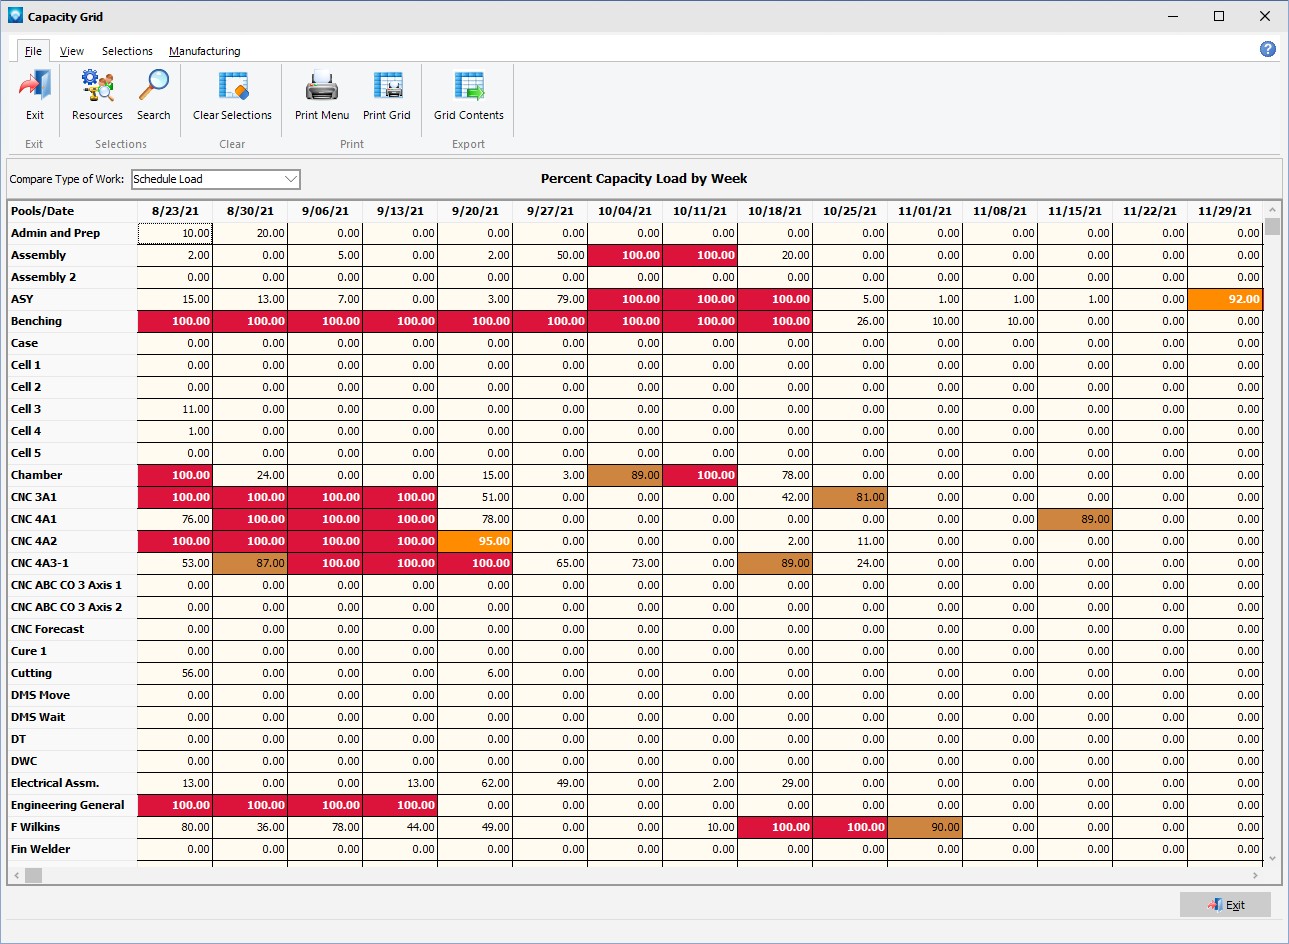
The Capacity Grid enables you to get a snapshot of the load by resource, pool, or department, either by day, week, month, or quarter. Each cell within the grid gives the percentage load for the selected time period. The cell load is color coded as follows:
1.If greater than 100% (because of infinite loads or schedule board moves to overload a resource), the cell is displayed with yellow text on a red background.
2.If 100%, the cell is displayed with white text on a red background.
3.If 90% to 99%, the cell is displayed with white text on an orange background.
4.If 80% to 89%, the cell is displayed with white text on a brown background.
5.If 79% load or less, the cell is displayed with black text on the regular grid background color.
The example window below shows the resource load by week starting on the week of August 23, 2021:
The following tabs and commands are available:
File
1.Resource Selections Select Selections | Resources to select resources, pools, or departments to graph.
2.Search Click on Search to perform the job search.
3.Clear Selections To clear your current search criteria, click on the Clear Selections button.
4.Runs With Jobs A Runs With Job Group can be set up. Select the job to be a Runs With job and select File | Runs With Jobs. The Runs With Jobs Window appears.
5.Print Menu Select File | Print Menu to print a DMS Report as set up by Module Report Settings.
6.Print Grid Select File | Print Grid to print the current grid graph.
View
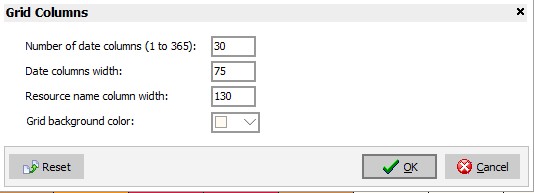
1.Grid Columns Select View | Grid Columns to display the grid column options. You can select the following options:
Selections
1.Resource Selections Select Selections | Resources to select resources, pools, or departments to graph.
2.Search Click on Search to perform the job search.
3.Clear Selections To clear your current search criteria, click on the Clear Selections button.
4.Time Scale The Time Scale for the capacity grid can be one of the following:
1.Shifts
2.Days
3.Weeks
4.Months
5.Quarters
5.Graph by Resources Select Selections | Graph by Resources to display the capacity grid by resource.
6.Graph by Pools Select Selections | Graph by Pools to display the capacity grid by pool.
7.Graph by Departments Select Selections | Graph by Departments to display the capacity grid by department.
Manufacturing
1.New Job To add a new job.
2.Edit Job To edit the first job in the Manufacturing Order job tree.
3.Calendar/Capacity Changes are changes you want to make to the manufacturing calendar such as holidays, planned overtime, planned shut downs, etc.
4.Resources is used to add, edit, delete resource settings.
5.Schedule Run Run a global schedule.
6.Job Updating is used to manually enter detailed time updates to a job.
A right click on the grid will display the popup menu shown below:
![]()
Select Dispatch Display to show the Dispatch Display for the selected Capacity Grid cell.