The Capacity Graph displays the loaded capacity for a resource, pool, or department. Either the loaded capacity or the percent load can be viewed on the graph. Several types of bars and a "ribbon" can be graphed showing:
- Capacity available for the resource, pools, or department.
- The loaded capacity or percent load.
- One or more selected jobs and their total load.
- Ribbon showing a selected type of work.
- Resource count showing the number of resources available.
- Capacity head count showing the head count capacity based on labor hours.
- Compare head count style shows the head count if a Compare Type of Work ribbon is being displayed.
- Load head count showing the head count load based on labor hours.
The color of each bar can be selected by the user.
To select the resource to graph, click on a resource in the tree. If graphing pools or departments, the pools or departments will appear in the tree enabling you to make selections.
The bar colors, bar style (bar shape), and whether or not to display a bar can be selected using Options | Set Bar Options.
The capacity graph below shows the capacity available (orange bar) and the loaded capacity (blue bar) for the resource Benching using a time scale of days. The resource has has a variable work week where the first week works 8 hours per day 5 days a week and the second week works 10 hours a day 4 days a week:

The following tabs and commands are available:
File
- Print Menu Select File | Print Menu to print a DMS Report as setup by Module Report Settings.
- Print Graph Select File | Print Graph to print the current graph.
- Print to PDF Select File | Print to PDF to print the capacity graph for the select resources in the resource tree or for all resources listed in the resource tree to a PDF.
- Create Bit Map Image Select File | Create Bit Map Image to create a bit map image of the selected resources. It is recommended no more than 6 resources at a time be written to the BMP file otherwise the image is too cluttered.
View
- Default menu tab
Selections
- Jobs Select Selections | Jobs to select jobs based on the job header information.
- Resource Selections Select Selections | Resources to select resources, pools or departments to graph.
- Run User Search Select Selections | Run User Search to run your saved user search
- Save User Search Select Selections | Save User Search to save the current search as your default search.
- Time Scale The Time Scale for the capacity graph can be one of the following:
- Shifts
- Days
- Weeks
- Months
- Quarters
- Graph by Resources Select Selections | Graph by Resources to display the capacity graph by resource.
- Graph by Pools Select Selections | Graph by Pools to display the capacity graph by pool.
- Graph by Departments Select Selections | Graph by Departments to display the capacity graph by department.
Options
- Overlay Bars If View | Overlay bars is selected, the bars shown on the graph are overlayed on top of each other. This option can be toggled on or off.
- Show Labels If View | Show Labels is selected, the bars on the graph will be shown with labels displaying the numerical total of each bar. This option can be toggled on or off.
- Percent Load If View | Percent Load is selected, the the graph bars will display the percentage load. This option can be toggled on or off.
- Pool Load If View | Pool Load is selected and grouping by Pools, the operation load assigned to a pool is displayed. When grouping by Pools the load bars show all resources that are in the pool even if the operation has not been specifically assigned by the user to the pool. If Pool Load is selected, then another bar appears on the graph that shows operations that have been assigned by the user to the pool. For example, if there are two operations such as:
- Operation Pool Resource Hours
- 10������� Mills Mill 1���� 5 hours
- 20������������� Mill 1���� 2 hours
- When you ask for the capacity graph to group by pools, it will display the Mills pool as having a total of 7 hours because Mill 1 is in the pool Mills.� If you ask to see the specific pool load assigned by the user, a third bar will appear that displays 5 hours as an operation was assigned the Mills pool. This enables you to see the resource load for all resources in a pool as well as the load assigned by the user to the pool. Note that the Pool Load and Job Load share the same bar on the graph and therefore cannot be displayed at the same time.
- Bar Types Select Options | Bar Types to set the options for what capacity bars you want to display, the colors, shape, etc.
- Theme The Options | Theme enables you to change the appearance of the graph. Various themes and colors can be selected.
Manufacturing
- New Job to add a new job.
- Edit Job to edit the first job in the Manufacturing Order job tree.
- Calendar/Capacity Changes are changes you want to make to the manufacturing calendar such as holidays, planned overtime, planned shut downs, etc.
- Resources is used to add, edit, delete resource settings.
- Schedule Run Run a global schedule.
- Job Updating is used to manually enter detailed time updates to a job.
- Start/Stop Clock The Start/Stop Clock Updating is an alternate method to to update a job with times and quantities typically used by a timekeeper or shop floor personnel.
- Start/Stop Clock Edit If using Start/Stop Clock Updating, the Edit Start/Stop Clock Job Updating enables an authorized user to edit existing start/stop clock entries.
Other Capacity Graph commands that are available are:
- Type of Work (Capacity) The type of work above the capacity graph for the capacity bars (orange bar) can be changed by selecting a new type of work.
- Compare Type of Work A ribbon can be added as a third parameter to the capacity graph displaying a different type of work. The ribbon enables you to compare the capacity type of work, the current load, and a ribbon type of work all in one graph. The Type of Work Ribbon prompt appears above the capacity graph.
- Data points The data points above the capacity graph and are the number of shifts, days, weeks, months or quarters you want to appear on the graph.
- Jump to Date The jump to date allows you to enter a date and have the Capacity Graph jump to that date and display the load on that day.
- View Dispatch Display You can view the dispatch display for the current operation by clicking on a bar in the capacity graph. The dispatch display will appear for the selected resource.
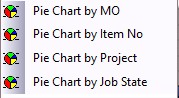
The Capacity Graph has a command where if you right click on a bar, the following popup menu appears enabling you to select a Capacity Pie Chart showing the hourly load by jobs, job identification, part number or job state. Once the pie chart has been displayed, you can switch between any of the four views:
The example below shows the capacity graph with the type of work "2nd Shift + SAT" capacity as a blue ribbon as well as the capacity head count in yellow:

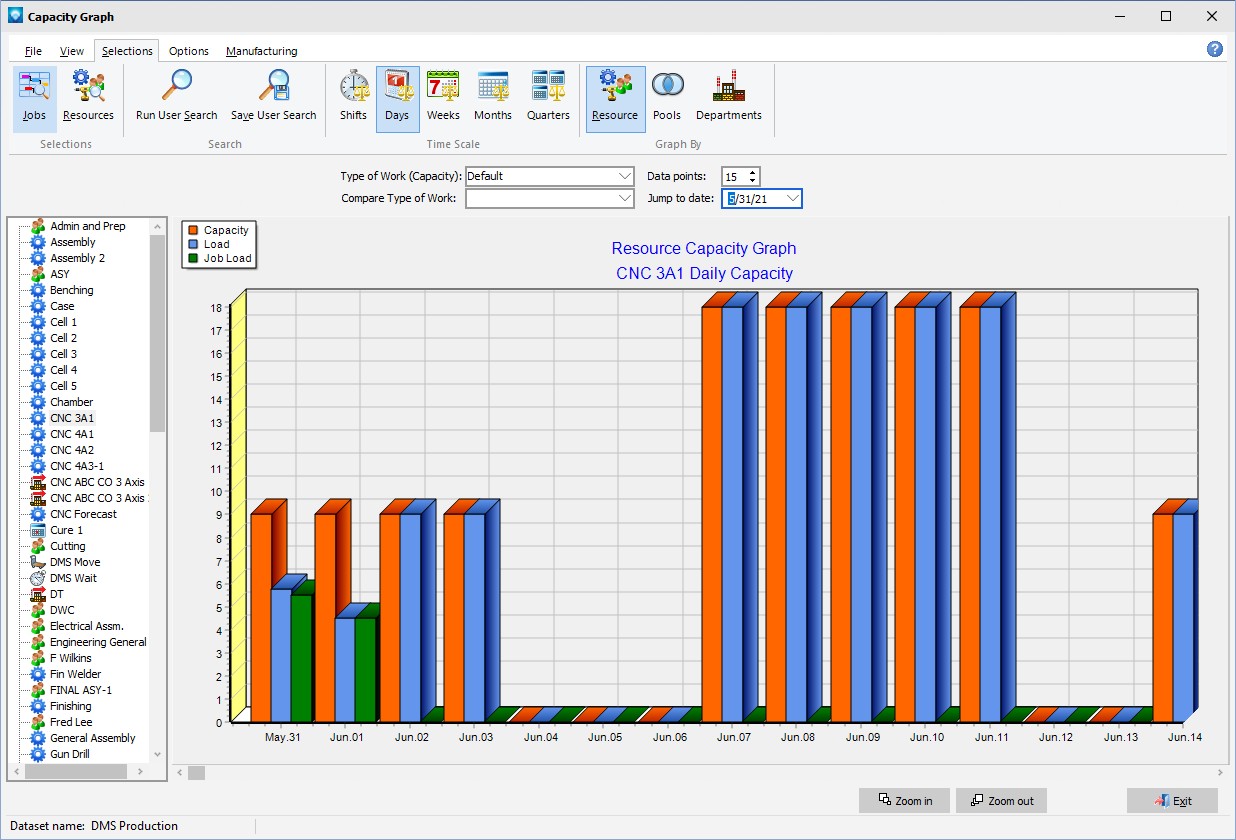
The example below shows the capacity, the load and the amount of time used by the selected jobs (green bar):
The example below shows a capacity graph grouped by pools. Clicking on a pool in the tree will display the total resources' capacities and load in the selected pool:

The example below shows a capacity graph grouped by departments. Clicking on a department in the tree graphs will display the total resources' capacities and load in the department:


