|
LOB Chart
|   |
|
LOB Chart
| |
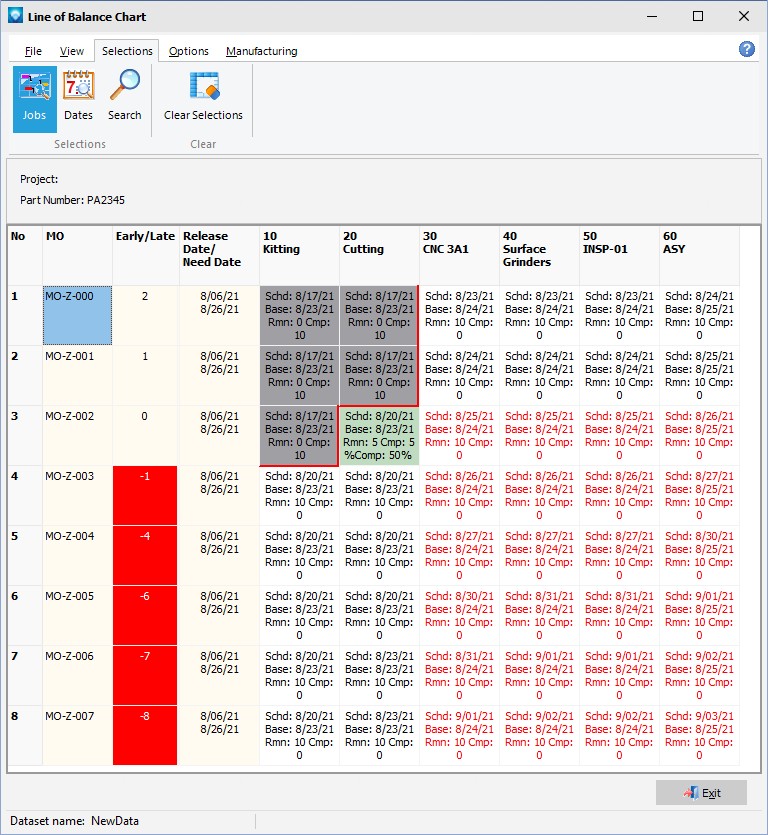
The LOB (Line of Balance) Chart is used to view the product process time line. The same parts or jobs with the same routings should be selected for the display, and these selected parts/jobs can have a date range selection. Prime operations are displayed for each job and show the operation schedule end date, the operation baseline date, and the percent completed for the operation. The chart not only displays whether or not the job is late, it also does a comparison between the operation schedule end date and the operation baseline date. If the operation schedule end date is later than the operation baseline date, the operation dates and percent completed are displayed in red.
An optional red line can be drawn on the chart that represents today's date or the first day of the schedule (schedule start date). Jobs above the red line are ahead of schedule. If dissimilar jobs are selected, the chart's red line will not be as easy to read and the comparisons of parts or projects may not make as much sense.
The chart is limited to displaying up to 1,000 jobs at a time for up to 1,000 unique operations. If these numbers are exceeded, DMS lets you know that you should select a smaller selection of jobs to display.
The chart options are set using the LOB Chart Options. The options include what job user fields you want to display, what operation information to display and use to gather like operations together, color selections, and options for the red line.
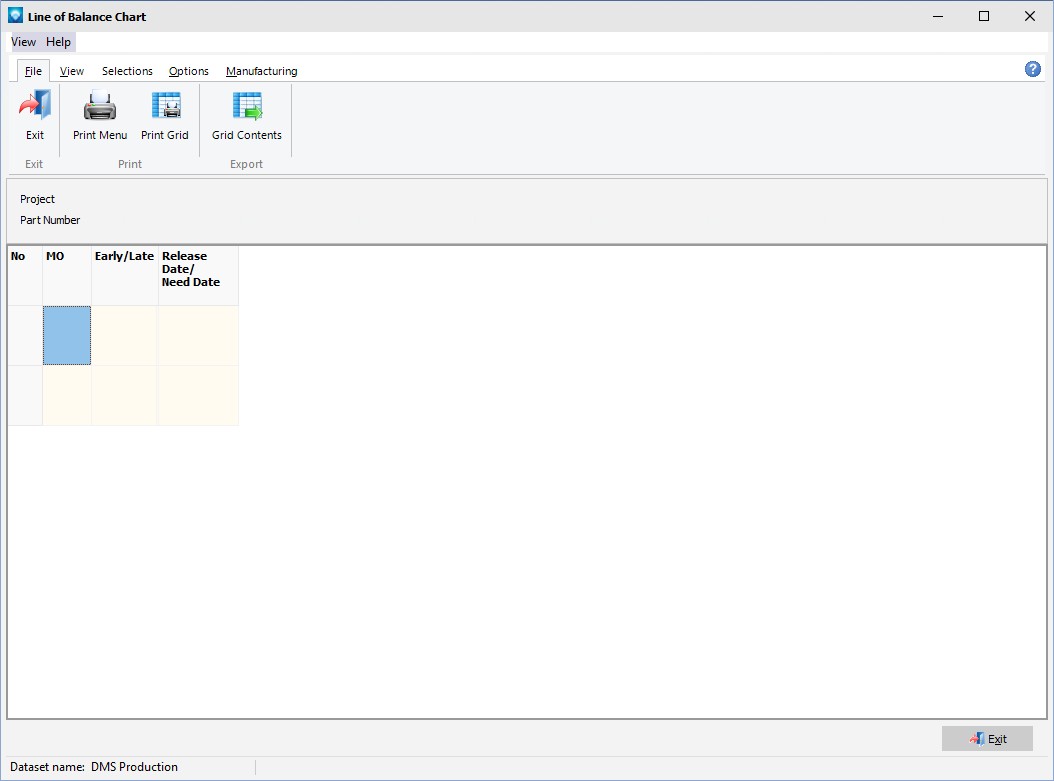
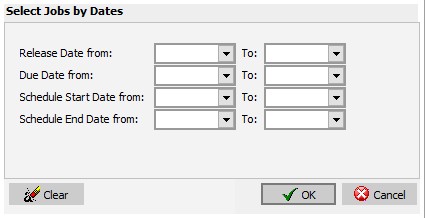
The LOB Chart is selected from the Manufacturing Orders Job Grid using Display | Lob Chart. The example screen below shows what the LOB Chart may look like when you first enter the display. The Order Number is displayed followed by the any user fields that have been selected to be displayed, an Early/Late count for the jobs, and the Release Date/Due Date column. From this screen you select what jobs you want to display plus an optional date range:
After job selections and date selection have been made on the Selections tab, press the Search button. The selected jobs will be displayed in the chart. In the example below, part number PA2345 was selected and the following jobs with that part number were displayed:
The following tabs and commands are available:
File
View
Selections
Manufacturing
The example below shows the LOB Chart after jobs were selected for a part called "P1000-Test". The order number is displayed along with:
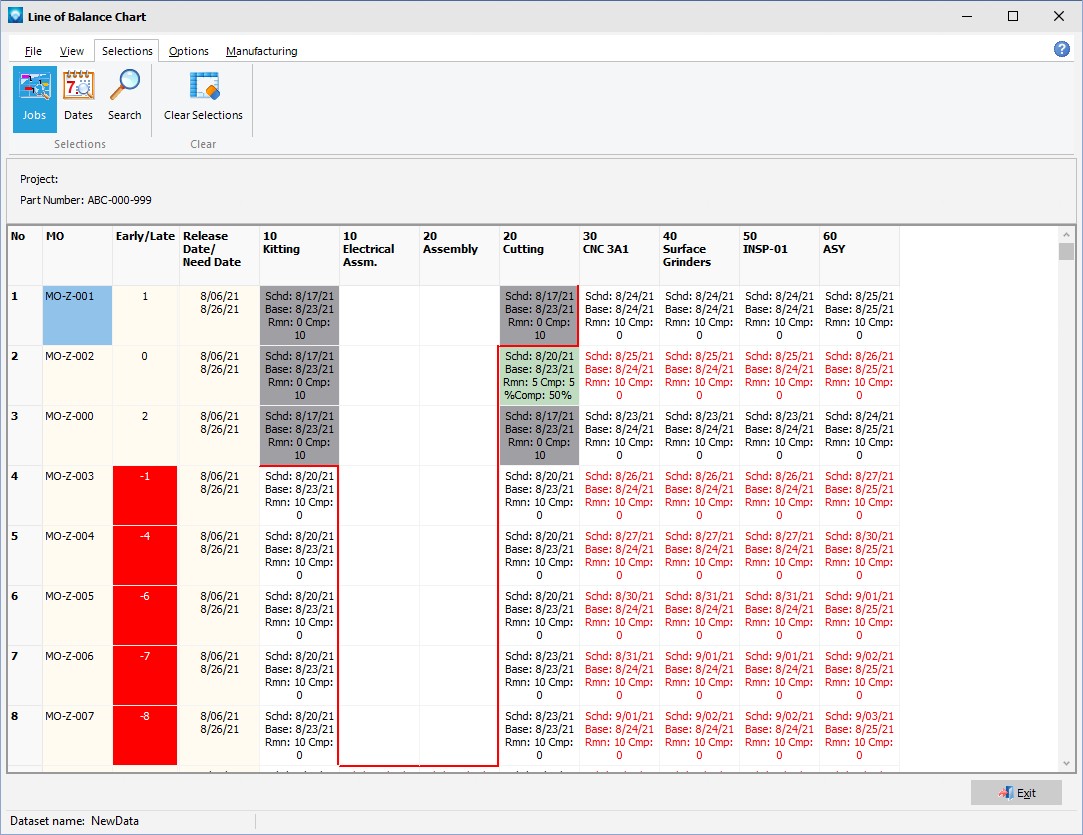
If dissimilar parts/jobs are selected, not all jobs may have the same operations. Operations not used by a job are left blank as in the example below:
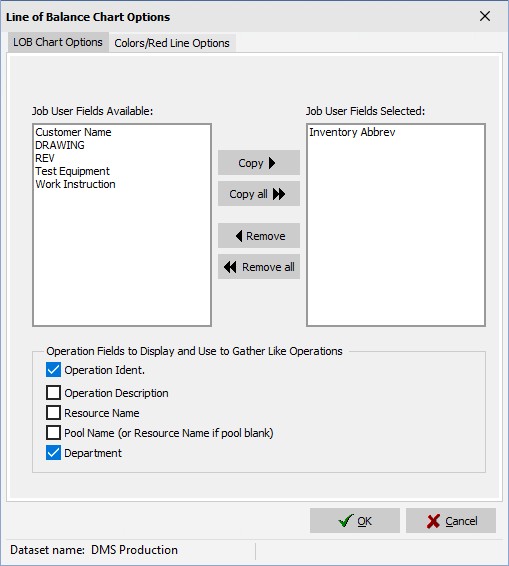
The LOB Chart Options has two tabs; one to select the job user fields and operation information to display, and a second tab to select colors and the red line options.
On this first tab (example below), the job user fields to display are selected in the list box. The order of the job user fields in the "Job User Fields Selected" list box is the order of how the user fields will be displayed on the LOB Chart. You can drag and drop job user fields in the "Job User Fields Selected" list box to change the display order.
The Operation Fields to Display and Use to Gather Like Operations is used to select what operation fields you want to display at the top of the chart in the operations section and it also defines how the LOB Chart will gather like operations together for the display. For the gathering of like operations, all the selected fields must match in order for the display to position the operations in the column. That is, if you select Operation Ident. and Resource Name, both these fields must match between jobs in order for the operations to be displayed under the same operation column.
You can display and gather on the following fields:
In the example below, the job user field "Inventory Abbrev" will be displayed in the LOB Chart. The operation column titles will be made up of the Operation Ident. and the Department. Also, Operation Ident. and the Department will be used to gather jobs operations into the same column:
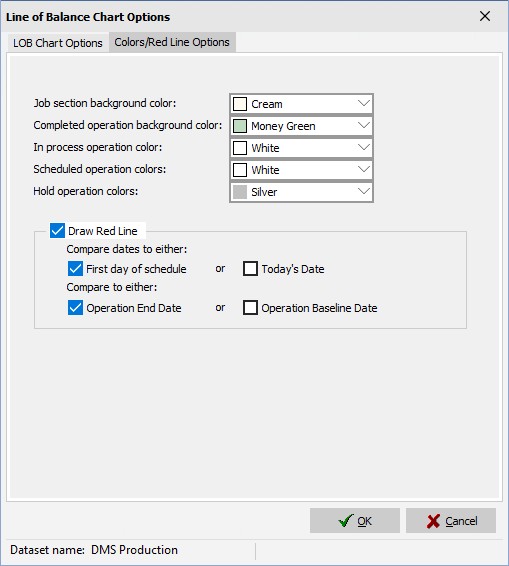
The second tab on the LOB Operations options is used to define colors and red line options. For colors you can select:
The red line options enable you to:
After the options have been selected, click OK to save the options. Click Cancel to ignore the changes. If OK is selected, any current information displayed in the LOB Chart disappears. You can refresh the displayed jobs by clicking on the Search button.