Assembly Gantt Chart |
|
The Assembly Gantt Chart displays one or more assemblies and the component relationships in a Gantt chart format. One or more assembly jobs can be selected.
When you first enter the Assembly Gantt Chart, a blank Gantt chart is displayed. Select File | Assembly to Graph to enter the assembly you wish to graph. The initial Assembly Gantt chart defaults to be sorted by assembly level of the assembly’s component jobs. When sorted by assembly level, job links between components are drawn, as in the example below. You can change the component job sort order but if the Assembly Gantt Chart is not sorted by assembly level then the relationship(s) between the component jobs will not be displayed, as the sort order may not be compatible with the component relationships.
An example screen of the Assembly Gantt Chart sorted by Assembly Level with the selected assembly 7000 displayed is shown below. The Assembly Gantt displays the Assembly Name on the row above the Assembly Components. A span bar is drawn from the start of the assembly to the assembly’s end. If the columns Plan Hrs, Rmn Hrs, or %Comp are selected to be displayed for the Job, these columns are totalled for the entire assembly and displayed on the Assembly Name row.
.png)
The Job Notes, Operation Notes, and Material Notes can be displayed by double clicking on the notes cell in the grid. For more information, please see Displaying Notes.
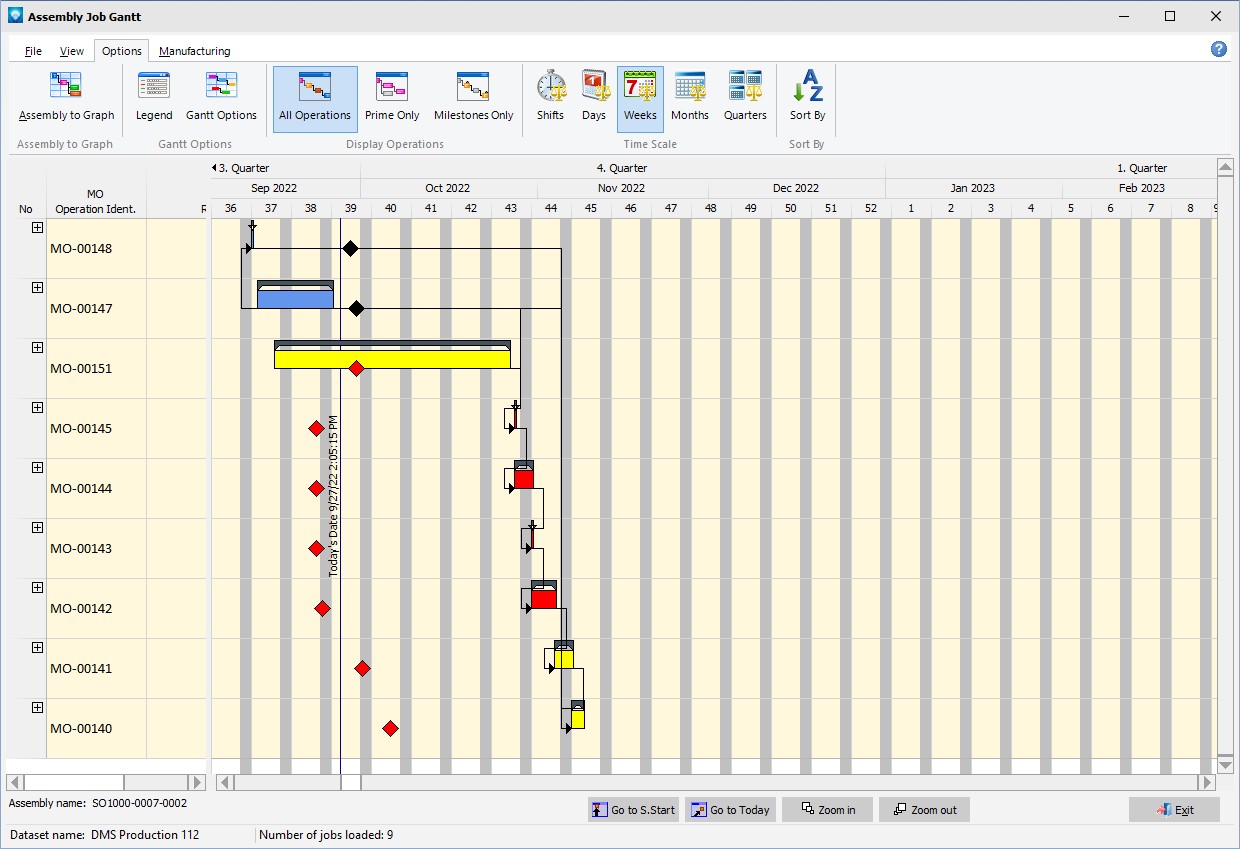
The Assembly Gantt Chart will show a bar in yellow if the component job is projected to be late, but the due date is after the current date (today's date). If the due date is earlier than the current date, the job is late and is shown in red.
The example below shows the Assembly Gantt Chart with the operations collapsed and sorted by Branch down to the final assembly. MO-00151, MO-001541, and MO-00140 are projected to be late, but since their due date is in the future compared to today’s date, the bars are shown in yellow. MO-00145, MO-00144, MO-00143, and MO-00142 are shown in red as their due dates are in the past compared to today's date. MO-00148 and MO-00147 are both projected to be on time:
The following tabs and commands are available:
File
1.Assembly to Graph Select File | Assembly to Graph to select one or more assemblies to graph. The following window appears:
.png)
Enter the an assembly name or the final order number of the assembly to graph. To add another assembly to graph, select the button ![]() and enter another assembly to graph.
and enter another assembly to graph.
2.New Job Add a new job using Manufacturing Order Job Details.
3.Edit Job Edit the selected job using Manufacturing Order Job Details.
4.Runs With Jobs A Runs With Job Group can be set up. Select the job to be a Runs With job and select File | Runs With Jobs. The Runs With Jobs Window appears.
6.Print Menu Select File | Print Menu to print a DMS Report as set up by Module Report Settings.
7.Print Gantt Select File | Print Gantt to print the current Gantt graph.
View
Options
1.Assembly to Graph Select File | Assembly to Graph to select an assembly or a range of assemblies to graph.
2.Legend Select Options | Legend to display the Gantt Chart Legend.
3.Gantt Options Select Options | Gantt Options to set the Assembly Gantt Display Options.
4.All Operations Select Options | All Operations to toggle on the option to display all operations.
5.Prime Only Select Options | Prime Only to toggle on the option to display prime operations only.
6.Milestones Only Select Options | Milestones Only to display only operations marked as Milestones.
7.Time Scale The Time Scale for the capacity graph can be one of the following:
1.Shifts
2.Days
3.Weeks
4.Months
5.Quarters
8.Sort By Select Options | Sort By Jobs to display a menu to sort the jobs by:
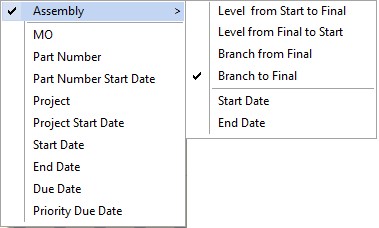
As well as sorting by various data fields, the Assembly Gantt can be sorted by the assembly components by selecting Assembly and then one of:
1.Level from Start to Final Draws assembly relationships and sorts components by level from the first starting component down to the final component.
2.Level from Final to Start Draws assembly relationships and sorts components by level from the final component down to the starting component.
3.Branch from Final Draws assembly relationships and sorts components by branch from the final component down to the starting component.
4.Branch to Final Draws assembly relationships and sorts components by branch from the starting component down to the final component.
5.Start Date The start date of each component job.
6.End Date The end date of each component job.
Manufacturing
1.New Job to add a new job.
2.Edit Job to edit the first job in the Manufacturing Order job tree.
3.Calendar/Capacity Changes are changes you want to make to the manufacturing calendar such as holidays, planned overtime, planned shut downs, etc.
4.Resources is used to add, edit, delete resource settings.
5.Schedule Run Run a global schedule.
6.Job Updating is used to manually enter detailed time updates to a job.
7.Start/Stop Clock The Start/Stop Clock Updating is an alternate method to update a job with times and quantities typically used by a timekeeper or shop floor personnel.
8.Start/Stop Clock Edit If using Start/Stop Clock Updating, the Edit Start/Stop Clock Job Updating enables an authorized user to edit existing start/stop clock entries.
A right click on the Gantt chart will display the popup menu shown below:
.png)
Valid popup commands are:
1.Go to Bar Start The popup menu command will move the Gantt chart to the start of the current bar.
2.Go to Bar End The popup menu command will move the Gantt chart to the end of the current bar.
3.Go to Release Date The popup menu command will move the Gantt chart to the selected job's release date .
4.Go to Job Due Date The popup menu command will move the Gantt chart to the selected job's due date.
5.Expand All Right click on the job/operation tree and select Expand All from the pop up menu to expand all the jobs' operations in the graph.
6.Collapse All Right click on the job/operation tree and select Collapse All from the pop up menu to collapse all the jobs' operations in the graph.
7.Material Display Use the right mouse button and select Material Display to display the material for the job using Material Display.
8.Edit Job/Operations Edit a job by double clicking on the job order number or the job bar, or highlight the job and select Edit Job/Operations.
9.Job Updating Update a job using Job Status Updating by highlighting the job or operation within a job and select Job Updating.
10.Quick Job Updating To select Quick Job Updating, use the right mouse button and click on a job or operation in the job tree.
11.Start/Stop Clock Updating To select Start/Stop Clock Updating, use the right mouse button and click on a job or operation in the job tree.
Other commands:
1.Click the Zoom in button to change the time scale to the next highest detail (quarters to months to weeks to days).
2.Click the Zoom out to button to change the time scale to the next lowest detail (days to weeks to months to quarters).
For the definition of symbols used on chart, please refer to the Gantt Chart Legend.