|
Overtime Analysis
|   |
|
Overtime Analysis
| |
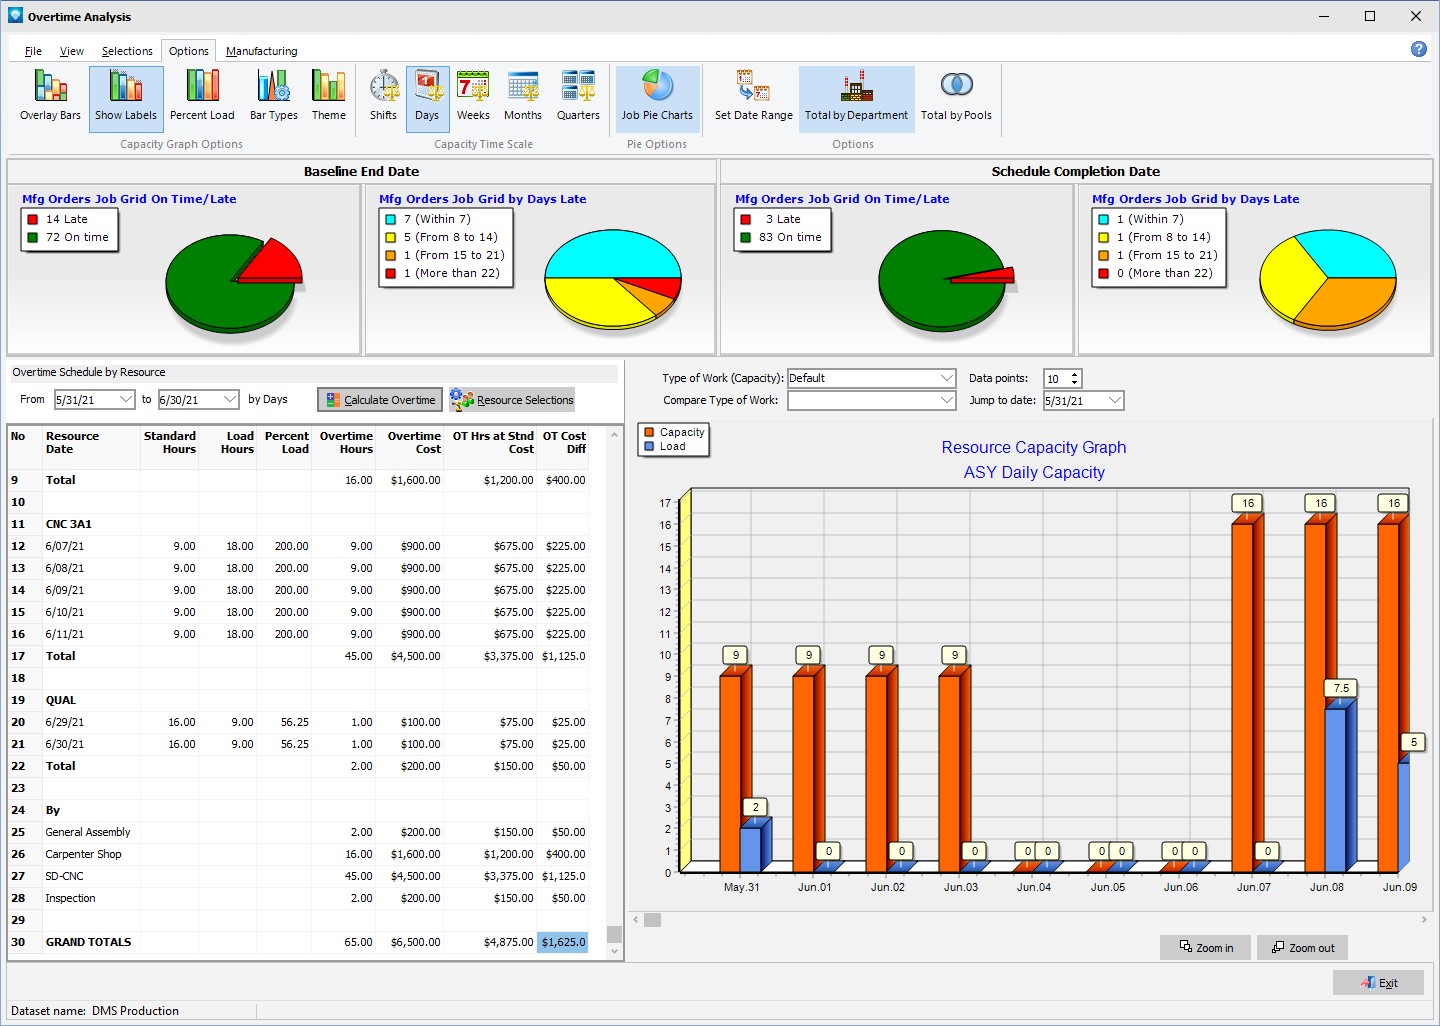
Overtime Analysis enables you to answer the questions "What do we need to do to bring late jobs in on time and what is the cost?"
Select Graphs | Overtime Analysis from the Mfg Orders Job Grid. The example below shows the Overtime Analysis after the Calculate Overtime button has been clicked. The Overtime Schedule by Resource grid has been scrolled to the last line and the Total by Departments has been selected thus total overtime hours and costs by departments is shown along with grand totals for the selected date range:
The following tabs and commands are available:
File
View
Selections
Pie Options
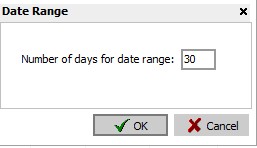
Options
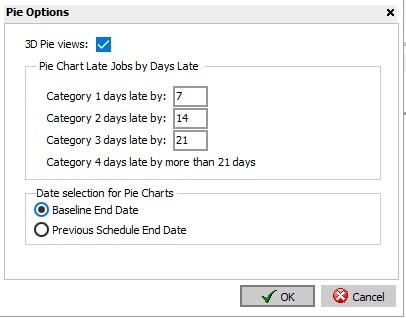
Once you have selected the settings click the OK button to save the settings.
Manufacturing
For the Overtime Schedule by Resource grid:
For the pie charts: