Job Gantt Chart
Previous Topic  Next Topic 

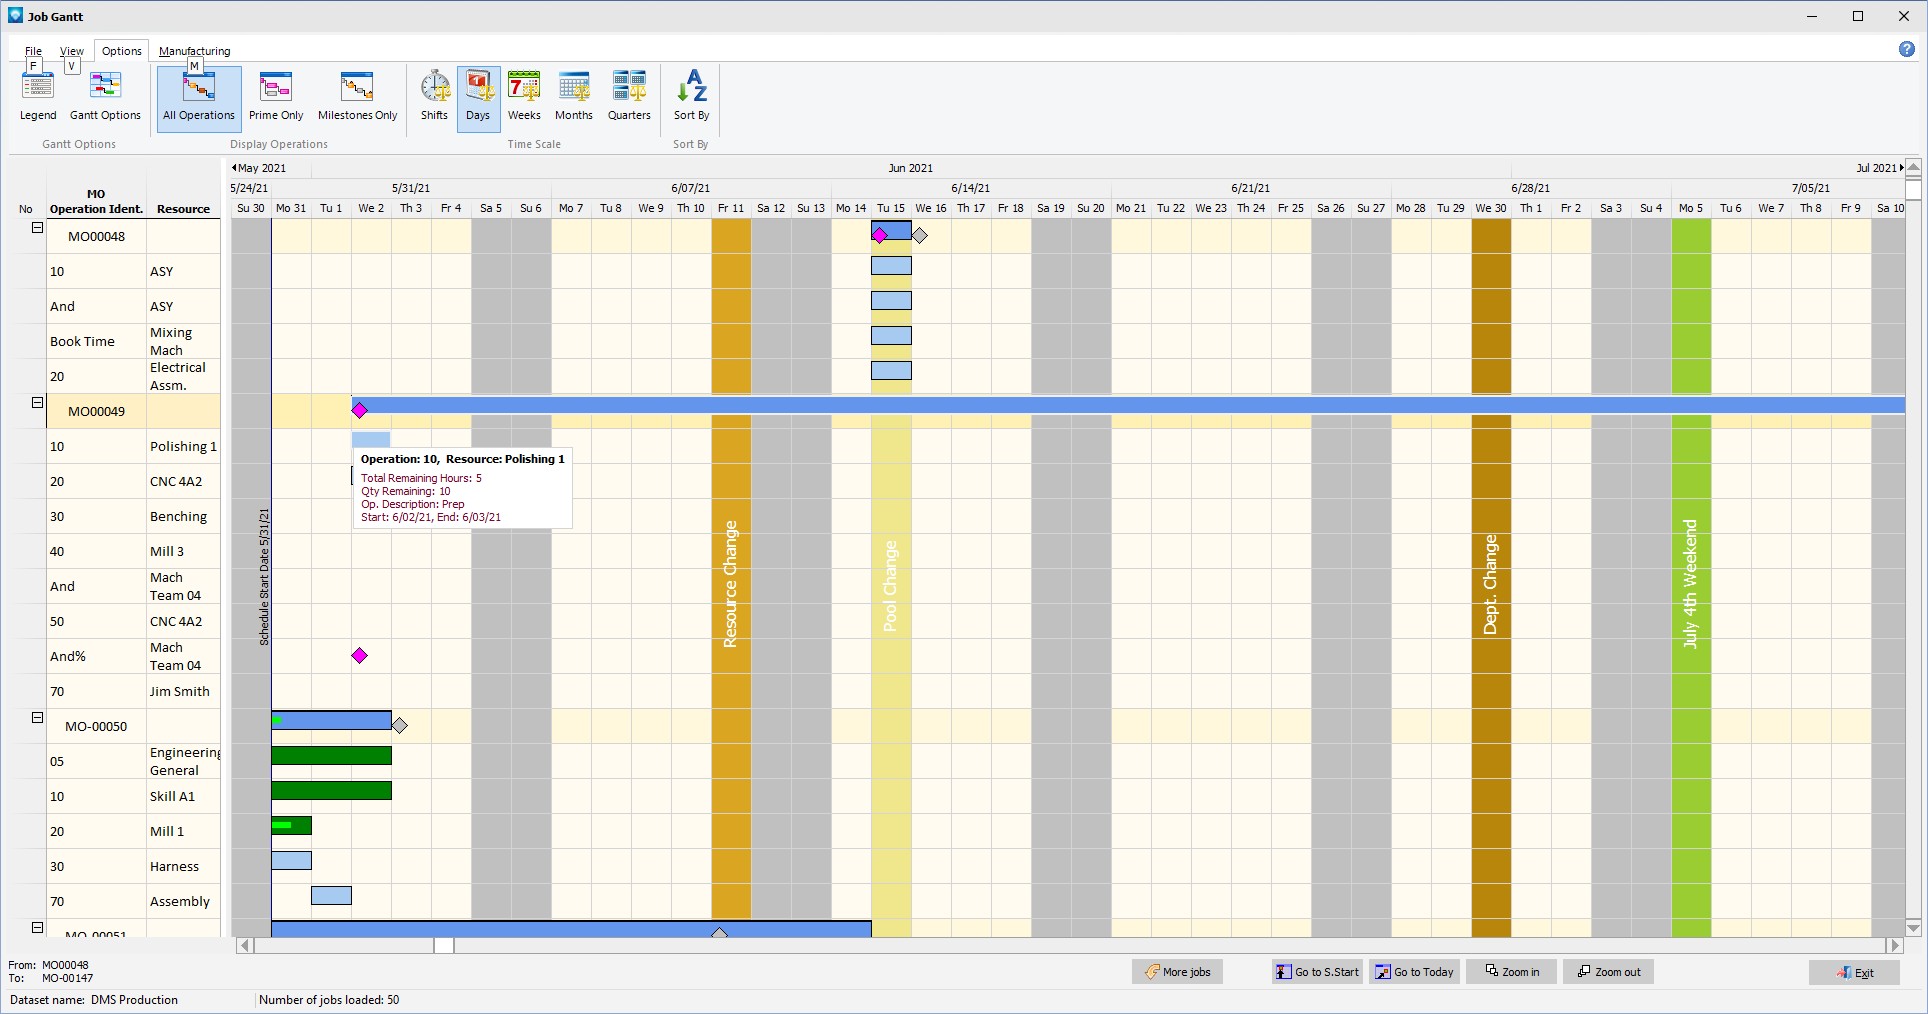
The Job Gantt Chart displays the current jobs in the Manufacturing Orders Job Grid in a Gantt chart.  For the definition of symbols used on chart, please refer to the Job Gantt Chart Legend.


Select the Job Gantt Chart by either File | Graphs | Job Gantt or by using Graphs | Job Gantt.  The first 50 jobs will be loaded into the Job Gantt as per the screen example below:


50 jobs are loaded at a time to reduce the system resource requirements and speed up the loading process.  After the jobs are loaded, the Job Gantt appears. 


Capacity changes are shown on the chart by vertical colored bars as follows; pools capacity change in light yellow, department capacity change in brown, resource capacity change in light orange, and calendar capacity changes in green. Capacity changes are shown only in the time scales of Shifts and Days.  Pool, department and resource capacity changes do not show the name of the effected pools, department or resource as many items may be part of the change.  Calendar capacity changes show the comment of the corresponding capacity change. 


If several capacity changes are on the same day, Calendar capacity changes take precedence over the other changes, than Resource changes are shown, than Pool changes are shown, and finally Department changes are shown.  Capacity changes are shown from the schedule start date forward 1 year. 


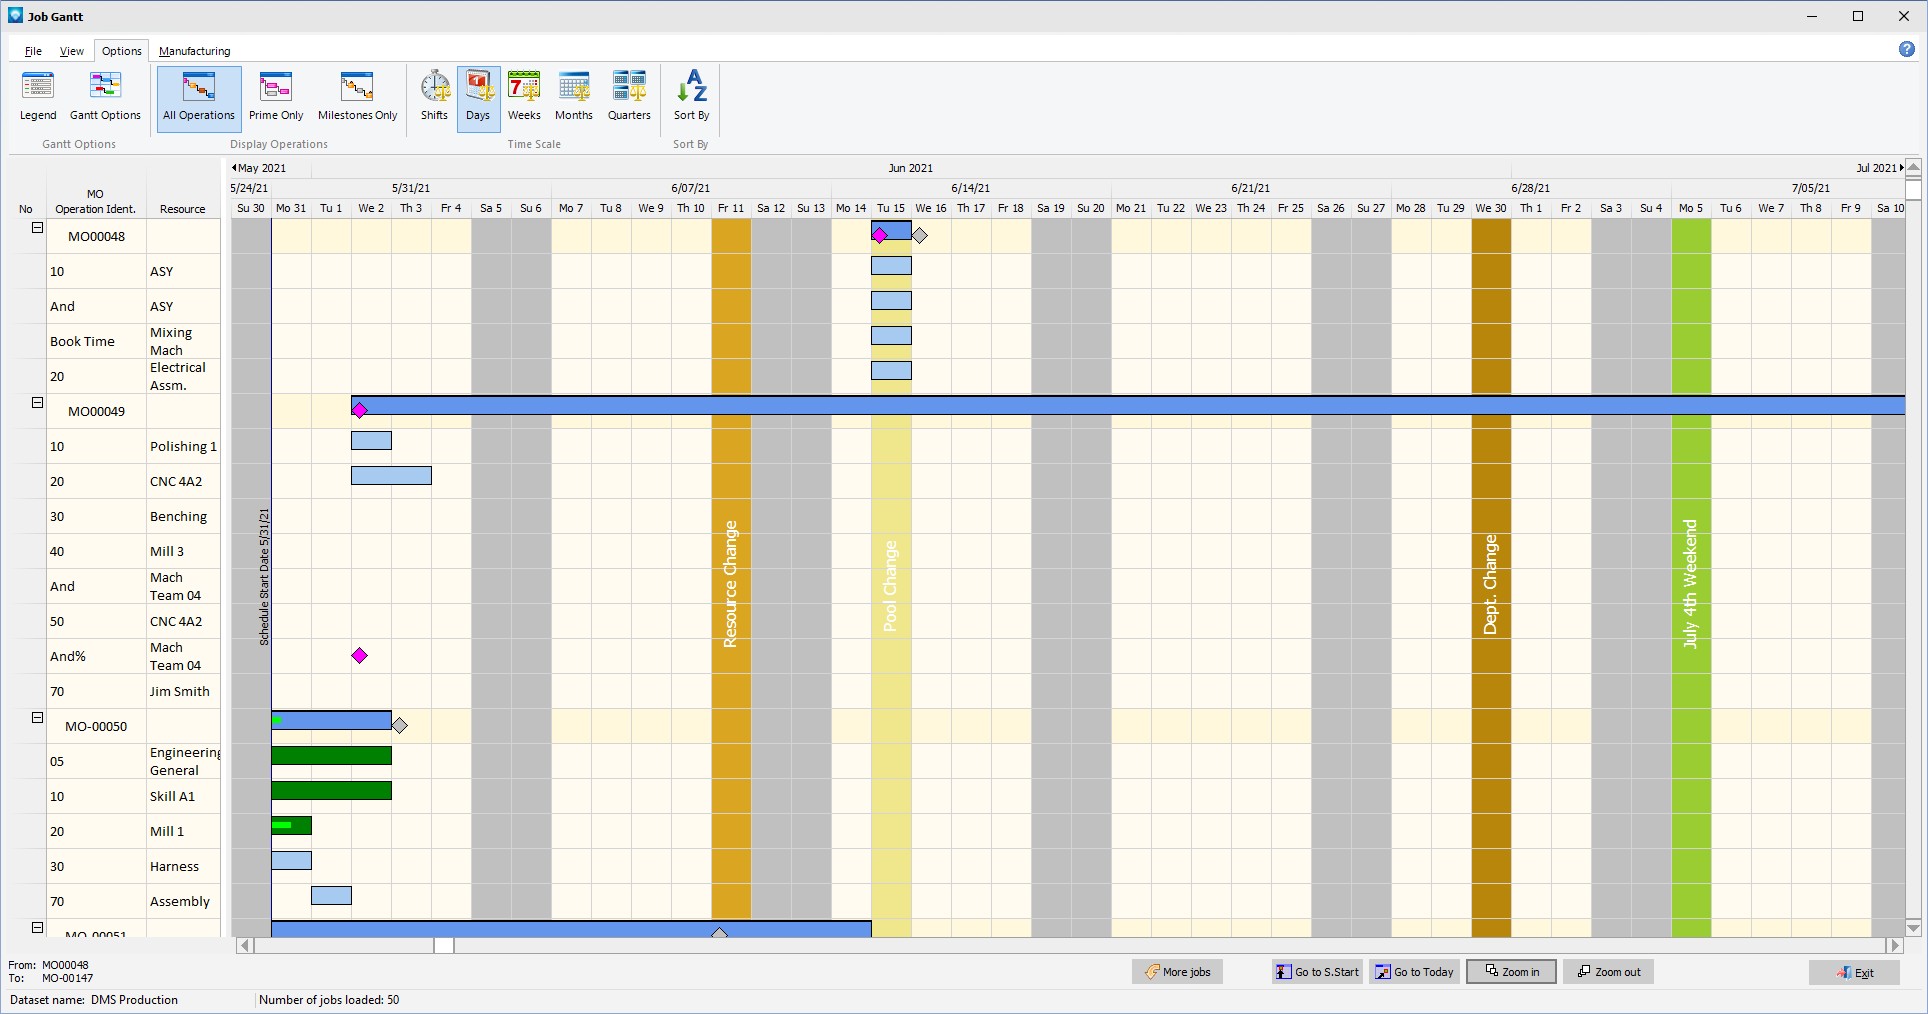
The example below shows the Job Gantt Chart:


The following tabs and commands are available:


File

  1. New Job  Add a new job using Manufacturing Order Job Details
  2. Edit Job  Edit the selected job using Manufacturing Order Job Details
  3. Runs With Jobs A Runs With Job Group can be setup.  Select the job to be a runs with job and select File | Runs With Jobs.  The Runs With Jobs Window appears.
  4. Print Menu Select File | Print Menu to print a DMS Report as setup by Module Report Settings.
  5. Print Gantt  Select File | Print Gantt to print the current Gantt graph. 


View

  1. Job/Operations Grid Columns
  2. Default menu tab


Options

  1. Legend Select Options | Legend to display the Job Gantt Chart Legend.
  2. Gantt Options Select Options | Gantt Options to set the display Job Gantt options
  3. All Operations  Select Options | All Operations to toggle on the option to display all operations.
  4. Prime Only  Select Options | Prime Only to toggle on the option to display prime operations only.
  5. Milestones Only  Select Options | Milestones Only to display only operations marked as Milestones.
  6. Time Scale The Time Scale for the capacity graph can be one of the following:
    1. Shifts
    2. Days
    3. Weeks
    4. Months
    5. Quarters
  7. Sort By  Select options | Sort By Jobs to display a menu to sort the jobs by:


    Assemblies (if displaying assembly jobs) can sort by Assembly Start Date or Assembly End Date


Manufacturing

  1. New Job to add a new job.
  2. Edit Job to edit the first job in the Manufacturing Order job tree.
  3. Calendar/Capacity Changes are changes you want to make to the manufacturing calendar such as holidays, planned overtime, planned shut downs, etc.
  4. Resources  is used to add, edit, delete resource settings.
  5. Schedule Run  Run a global schedule.
  6. Job Updating  is used to manually enter detailed time updates to a job.
  7. Start/Stop Clock  The Start/Stop Clock Updating is an alternate method to to update a job with times and quantities typically used by a timekeeper or shop floor personnel.
  8. Start/Stop Clock Edit  If using Start/Stop Clock Updating, the Edit Start/Stop Clock Job Updating enables an authorized user to edit existing start/stop clock entries. 


A right click on the Gantt chart will display the popup menu shown below.


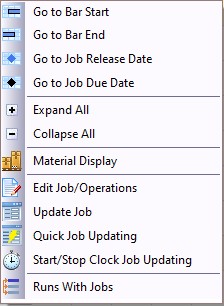
Valid popup commands are:


  1. Go to Bar Start  The popup menu command will move the Gantt chart to the start of the current bar.
  2. Go to Bar End  The popup menu command will move the Gantt chart to the end of the current bar.
  3. Go to Release Date  The popup menu command will move the Gantt chart to the selected job's release date .
  4. Go to Job Due Date  The popup menu command will move the Gantt chart to the selected job's due date.
  5. Expand All  Right click on the job/operation tree and select Expand All from the pop up menu to expand all the jobs' operations in the graph.
  6. Collapse All  Right click on the job/operation tree and select Collapse All from the pop up menu to collapse all the jobs' operations in the graph.
  7. Material Display Use the right mouse button and select Material Display to display the material for the job using Material Display
  8. Edit Job Edit a job by double clicking on the job order number or the job bar, or highlight the job and select File | Edit Job or click on the edit icon .
  9. Edit Operations Edit a job's operations by double clicking on the operation or the operation bar, or highlight the operation and click on the edit icon .
  10. Update Job Update a job using Job Status Updating by highlighting the job or operation within a job and either select File | Job Updating or click on the job updating icon .
  11. Quick Job Updating To select Quick Job Updating, use the right mouse button and click on a job or operation in the job tree.
  12. Start/Stop Clock Updating  To select Start/Stop Clock Updating, use the right mouse button and click on a job or operation in the job tree.
  13. Runs With Jobs  A Runs With Job Group can be setup by selecting the job to be a runs with job and either select File | Runs With Jobs or right click on the Job Tree and select Runs With Jobs from the popup menu.  The Runs With Jobs Window appears.


Other commands:

  1. Click on the More Jobs button to add the next 50 jobs to the graph.  After clicking on the button, jobs are loaded into the graph and the next 50 jobs are available to be viewed.
  2. Click the Zoom in button to change the time scale to the next highest detail (quarters to months to weeks to days)
  3. Click the Zoom out to button to change the time scale to the next lowest detail (days to weeks to months to quarters)
  4. To display a bar or graph symbols details, hover the mouse cursor over the bar/symbol.  A popup hint will appear displaying details on the bar/symbol.  The example below shows a Gantt chart with a popup window giving details of a bar: