Overtime Analysis |
|
Overtime Analysis enables you to answer the questions "What do we need to do to bring late jobs in on time and what is the cost?"
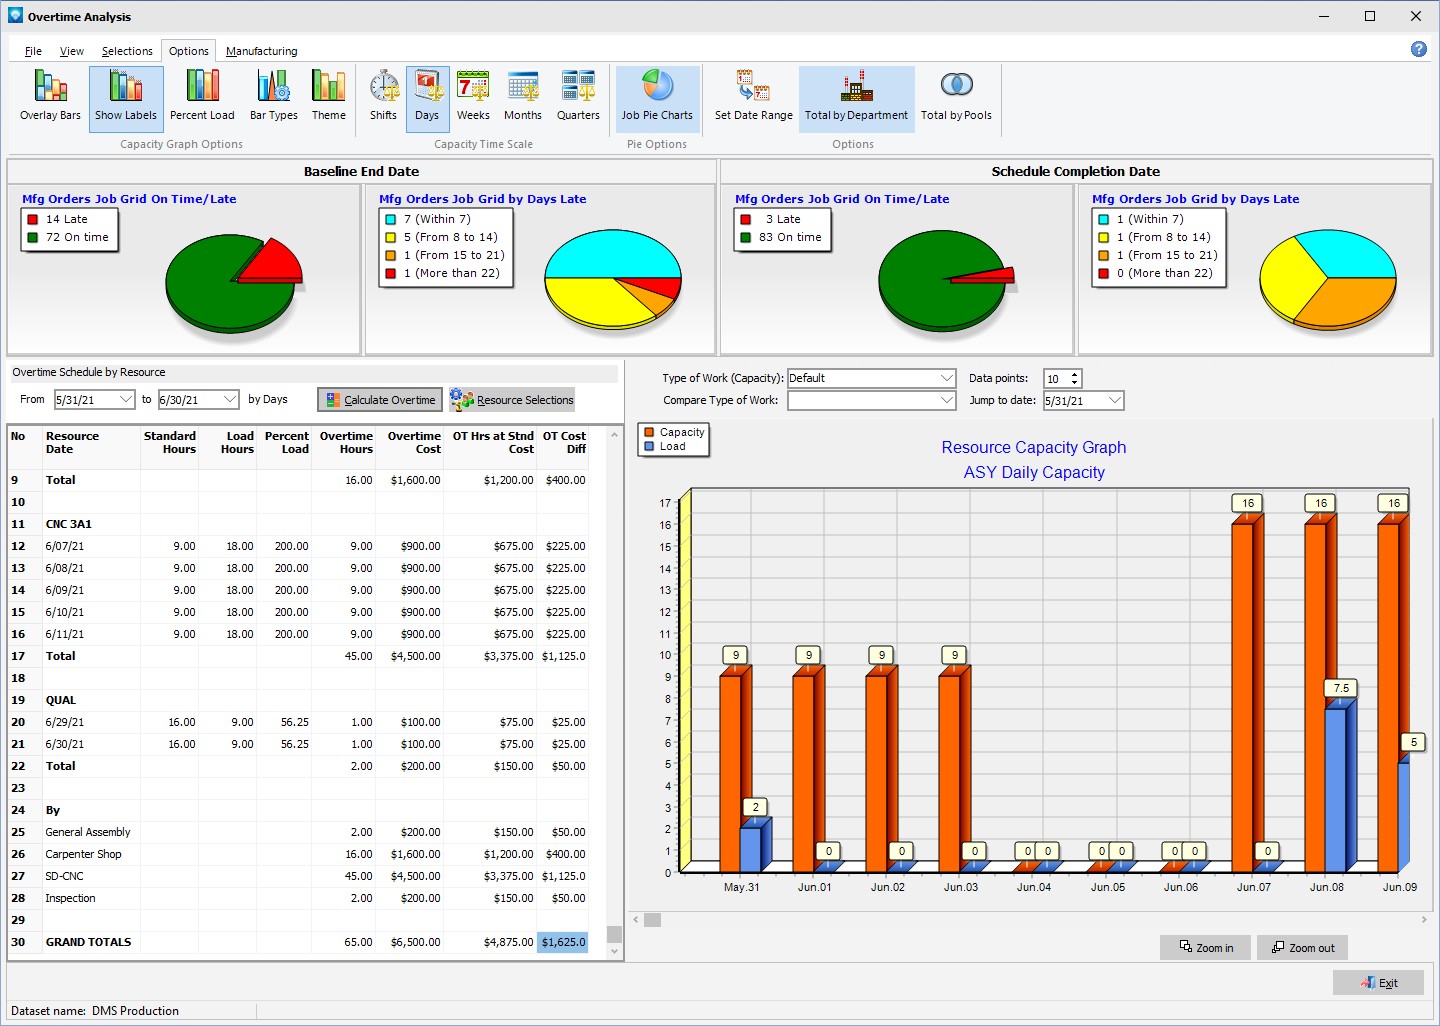
Select Graphs | Overtime Analysis from the Mfg Orders Job Grid. The example below shows the Overtime Analysis after the Calculate Overtime button has been clicked. The Overtime Schedule by Resource grid has been scrolled to the last line and the Total by Departments has been selected, thus total overtime hours and costs by departments is shown along with grand totals for the selected date range:
The following tabs and commands are available:
File
1.Print Menu Select File | Print Menu to print a DMS Report as setup by Module Report Settings.
2.Print Grid Select File | Print Grid to print the Overtime Schedule by Resource grid.
3.Export Overtime Grid The File | Export Overtime Grid enables you to export the data in the Overtime Schedule by Resource grid to either a CVS text file, in Word DOC format, or in Excel file format.
View
Selections
1.Jobs Select Selections | Jobs to select jobs based on the job header information.
2.Resource Selections Select Selections | Resources to select resources, pools or departments to graph.
3.Final Assembly/Regular Jobs Select Selections | Final Assembly/Regular Jobs to toggle on the option to include final assembly jobs and regular jobs only in the pie count.
4.Mfg Orders Job Grid Select Selections | Mfg Orders Job Grid to toggle on the option to include all jobs that were selected in the Mfg Orders Job Grid in the pie count.
Pie Options
1.Pie Options Select Pie Options to change the options for the pie charts as follows.
2.Equal Size Pies Select Pie Options | Equal Size Pies to make the three top job pies of equal size.
3.Pie Profile by Hours Select Pie Options | Pie Profile by Hours to set the left bottom pie profile to be calculated by hours.
4.Pie Profile by Head Count Select Pie Options | Pie Profile by Head Count to set the left bottom pie profile to be calculated by hours. The Pie Profile by Hours is also automatically selected.
5.Pie Profile by % Select Pie Options | Pie Profile by % to set the left bottom pie profile to be calculated by percent of load.
6.3D Pie Profile Select Pie Options | 3D Pie Profile to display the left bottom pie profile in 3D.
Options
1.Overlay Bars Select Options | Overlay Bars to show the bars on the bar graph are overlayed on top of each other. This option can be toggled on or off.
2.Show Labels Select Options | Show Labels to show each bar with labels displaying the numerical total of each bar. This option can be toggled on or off.
3.Percent Load Select Options | Percent Load to display the bars in percentage load. This option can be toggled on or off.
4.Bar Types Select Options | Bar Types to set the options for what capacity bars you want to display, the colors, shape, etc.
5.Theme Select Options | Theme to change the appearance of the graphs. Various themes and colors can be selected and will affect both the pie charts and the bar charts. The 3D selection in the themes affects the bar charts only.
6.Time Scale The Time Scale for the resource capacity graph can be one of the following:
1.Shifts
2.Days
3.Weeks
4.Months
5.Quarters
7.Job Pie Charts Selecting Options | Job Pie Charts will display the example window below: 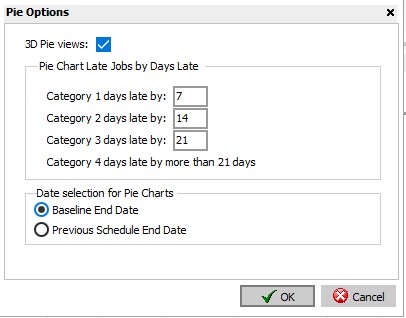
8.You can select:
1.3D pie displays
2.Pie chart late jobs by days late settings for the three categories
3.The Date selection for the first two pie charts to compare the schedule end date with either the baseline end date or the previous schedule end date
9.Once you have selected the settings click the OK button to save the settings.
10.Set Date Range The Options | Set Date Range enables you to set the default date range for the Overtime Schedule by Resource. The "From" date defaults to the start date of the last schedule run and the "to" date is the schedule start date plus the number of days for date range. In the example below, the "to" date will be the schedule start date plus 30 days:
.png)
11.Totals by Departments The Options | Totals by Departments will instruct the Overtime Schedule by Resource grid to total the overtime by departments. Either Total by Departments or Totals by Pools can be selected, but not both.
12.Totals by Pools The Options | Totals by Pools will instruct the Overtime Schedule by Resource grid to total the overtime by pools. Either Total by Departments or Totals by Pools can be selected, but not both.
Manufacturing
1.New Job to add a new job.
2.Edit Job to edit the first job in the Manufacturing Order job tree.
3.Calendar/Capacity Changes are changes you want to make to the manufacturing calendar such as holidays, planned overtime, planned shut downs, etc.
4.Resources is used to add, edit, delete resource settings.
5.Schedule Run Run a global schedule.
6.Job Updating is used to manually enter detailed time updates to a job.
7.Start/Stop Clock The Start/Stop Clock Updating is an alternate method to update a job with times and quantities typically used by a timekeeper or shop floor personnel.
8.Start/Stop Clock Edit If using Start/Stop Clock Updating, the Edit Start/Stop Clock Job Updating enables an authorized user to edit existing start/stop clock entries.
For the Overtime Schedule by Resource grid:
1.To determine if a resource is working overtime, the Standard Hours profile for the resource is used. If the loaded hours are greater than the standard hours profile, then the difference between the standard hours profile and the loaded hours is assumed to be overtime.
2.To display the overtime by resource, click the Calculate Overtime button on top of the grid.
3.The default for the date range is 30 days out from the start date. You can enter any date range you want. After entering new dates, press the Calculate Overtime button to recalculate the grid.
4.The Resource Selections button can be used to select which resources you want to see in the grid. After making the resource selections, press the Calculate Overtime button to recalculate the grid.
5.The Job Selections affects the pie charts and job load bar on the capacity graph only. The job selections do not affect the overtime analysis grid.
6.When you double click on the grid, the corresponding resource is shown in the capacity graph. If you double click on a bar in the capacity graph, the Dispatch Display is shown.
7.To calculate costs, the Standard Cost/Hr and the Overtime Cost/Hr defined on the Resources tab is used.
For the pie charts:
1.The Apply to Pie Charts selection enables you to select All Final Assembly and Regular Jobs, Job Selections to select only those jobs selected using the Job Selections button, or Mfg Orders Job Grid Selections which selects all jobs in the Mfg Orders Job Grid. Whatever is selected applies to the four pie charts only.
2.The first pie chart shows the schedule completion date compared to either the baseline completion date or the previous schedule end date. Select View | Pie Job Options to select either the baseline completion date or previous schedule end date for the calculation.
3.The second pie chart shows jobs late by number of days categories. The schedule completion date is compared to either the baseline completion date or the previous schedule end date. Select View | Pie Job Options to select either the baseline completion date or previous schedule end date for the calculation.
4.The third pie chart shows schedule completion date compared to the due date.
5.The fourth pie chart shows jobs late by number of days categories. The schedule completion date is compared to the due date.
6.The pie charts can be rotated by clicking on the background using the left and right mouse keys.
7.A larger view of the pie charts can be displayed by clicking on the title of one of the pie charts.
8.You can click on a pie slice to see what jobs make up that slice.