|
Project Gantt Chart
|   |
|
Project Gantt Chart
| |
The Project Gantt draws a Gantt chart of jobs that are part of a project as defined by the DMS Job Identification. Projects and their jobs to graph are selected from Mfg Orders Job Grid. A bar is drawn for each project, which is a summary of all the jobs in the project, followed by each job within the project. Note that the projects and jobs graphed are dependent on the selections made in the Mfg Orders Job Grid.
In Mfg Orders Job Grid, select Graphs | Project Gantt to graph the projects and their jobs.
The Project Gantt verifies the graph:

Click Yes to continue or No to abort the Project Gantt. If Yes is selected, the Project Gantt is loaded with jobs:
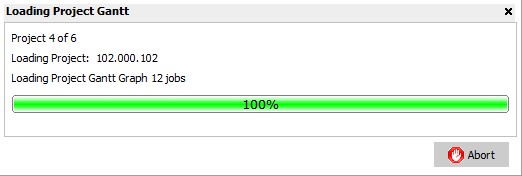
You can abort the loading of projects and jobs into the Project Gantt by clicking on the Abort button. If Abort is selected, DMS will ask you if you want to abort loading the remaining projects. Click Yes to abort the load and display the Project Gantt with the projects and jobs that have already been loaded. Click No to continue loading projects and jobs.
Once the selected projects and jobs have been loaded, the Project Gantt chart is displayed:

To display a bar or graph symbols detail hover the mouse cursor over the bar/symbol. A popup hint will appear displaying details on the bar/symbol.
The following tabs and commands are available:
File
View
Options

Manufacturing
A right click on the Gantt chart will display the popup menu shown below.

The following popup commands are available by using the mouse right click on the graph:
The windows below shows an example of the Job Gantt popup command selected for job MO00100:

When a job is selected to be graphed from the Project Gantt, only the selected job appears in the Job Gantt.