Job Analysis enables you to look at the details of a job and its operations. Queue times are displayed to help locate bottlenecks.
The display information is selected by the user (see Job Analysis Display Selections). As you scroll through operations, the operations resource capacity and load are displayed in a graph. If an operation does not have a resource (i.e. it is a comment or a schedule command) the capacity graph does not display any bars.
The Job Analysis is selected from the Graphs menu of Manufacturing Orders Job Grid or by right clicking on a job in the Manufacturing Orders Job Grid when the grid has the Select Multiple Rows off.
Job information displayed includes:
- Delivery Status The delivery status displays if the job is early and by how many days it is early, on time, or late and the number of days late. If the job state is not schedule, then the delivery status displays the job state.
- Planned Lead Time The planned lead time is the number of days from the job release date to the job due date.
- Current Lead Time The current lead time is the number of days from either the job release date or the schedule start date (which ever is the latest date) to the schedule due date.
- Flow Time in Days The flow time in days is the number of days from the current job schedule start date to the current job schedule end date.
- % Complete The percent complete is a status bar showing the total percentage complete for the job.
- Total Queue Days The total queue days are the total number of operation queue days for the job.
Total Hours displayed includes:
- Planned Hours The total planned hours for the job.
- Remaining Hours The total remaining hours for the job.
- Planned Resource The total planned hours for all "Resource" type resources.
- Remaining Resource The total remaining hours for all "Resource" type resources.
- Planned Labor The total planned hours for all "Labor" type resources.
- Remaining Labor The total remaining hours for all "Labor" type resources.
- Planned Outsource The total planned hours for all "Outsource" type resources.
- Remaining Outsource The total remaining hours for all "Outsource" type resources.
- Planned Prepare The total planned hours for all "Prepare" type resources.
- Remaining Prepare The total remaining hours for all "Prepare" type resources.
- Planned Break The total planned hours for all "Break" type resources.
- Remaining Break The total remaining hours for all "Break" type resources.
Operation information displayed includes:
- % Complete The percent complete is a status bar showing the total percentage complete for the operation.
- Queue Days The queue days are the number of days from the previous operation end date to the current operation’s start date. If the operation is the first active operation in the job, then instead of the previous operation end date being used, either the job release date or the schedule start date (which ever date is later) is used.
- Queue Hours Queue hours measure the queue time in hours between the previous operation and the current operations. The queue hours does not include any hours from the previous operation’s end shift nor does it include any hours from the current operation’s start shift. If the operation is the first active operation in the job, then instead of the previous operation end date being used, either the job release date or the schedule start date (which ever date is later) is used.
The Previous Job and Next Job buttons at the bottom of the window can be used to scroll through the jobs. The Previous and Next jobs are based on the current selection in the Mfg Orders Job Grid. As you scroll through the jobs, the corresponding job is selected in the Manufacturing Orders Job Grid. Similarly, if you have Job Analysis active, as you click on jobs or scroll through jobs in Manufacturing Orders Job Grid, the corresponding job is displayed in the Job Analysis window. Note that depending on the number of operations, scroll through Manufacturing Orders Job Grid with the Job Analysis window active will slow down the scrolling.
Each panel in the Job Analysis window can be resized depending on your preference. The panels that can be resized are:
- Job information
- Capacity Graph
- The height of the operations grid.
The settings are saved for each user.
The capacity graph can optionally display a different type of work so that you can see available overtime. Note that changes to the capacity graph selections though the View menu using Job Analysis Display Selections are unique to the Job Analysis; that is, changes made in the Job Analysis do not affect the the Capacity Graph displayed in other areas of DMS.
An example of the job analysis window is shown below. If Job Multi Template are used, the information appears in a tab next to the Job tab. Likewise, any External Database Display tabs also appear next to the Job tab as in the example below, the End Date Compare tab is an external database display. If you are displaying operations Notes in the Operation Grid, the first part of the Notes will appear in the column. If you double click on the Notes cell the row height will automatically expand to display the entire Notes. If you double click on the cell again, the Notes will collapse to one line. The example below shows the Notes column operation 10 being displayed after a double click. And and Or commands lines can be expanded or collapsed using the tree in the first column of the Operations Grid. Pressing the – sign will collapse the lines; pressing the + sign will expand the lines:
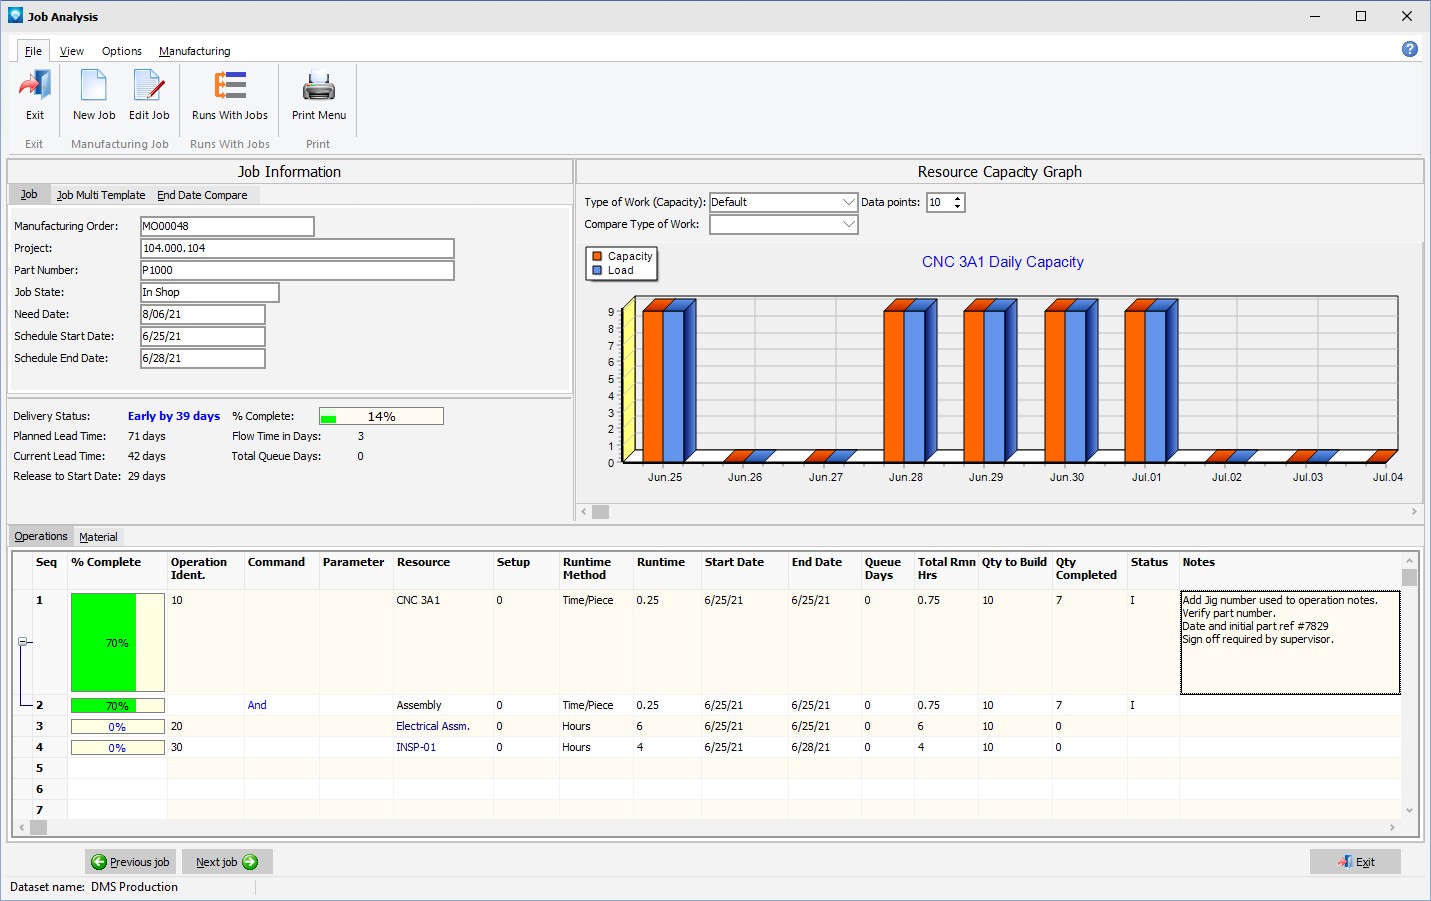
You can resize the columns by positioning the mouse over the bar  between the columns in the heading and drag the column to the desired with.
The following tabs and commands are available:
File
- New Job select Manufacturing | New Job to add a new job.
- Edit Job To edit the job select Manufacturing | Edit Job, or right click on the job panel or the operations grid and select Edit Job to edit the existing job. To edit the current job's operations you can double click on an operation in the operation grid or right click and select Edit Job/Operations.
- Runs With Jobs A Runs With Job Group can be setup. Select the job to be a runs with job and select File | Runs With Jobs. The Runs With Jobs Window appears.
- Print Menu Select File | Print Menu to print a DMS Report as setup by Module Report Settings.
View
- Job Sets the job fields to display on the job panel.
- Operations Grid Columns Sets the operation grid columns to be displayed.
- Material Grid Columns Sets the material gird columns to be displayed.
- Total Hours Sets the grid options to display the planned and remaining hours for the job.
- Refresh Refreshes the current job display.
- Reset Window Resets the Job Analysis windows to the default size.
- Default Menu Tab
Options
- Overlay Bars Select Options | Overlay bars to toggle on/off the bars shown on the graph. If on, the bars are overlayed on top of each other. If off, the bars appear side by side.
- Show Labels Select Options | Show Labels is selected to toggle on/off the bars on the graph. If on bars will be shown with labels displaying the numerical total of each bar.
- Percent Load Select Options | Percent Load to graph bars as a percentage load. This option can be toggled on or off.
- Head Count Select Options | Head Count to display bars of the number of resources (labor or machines) for each time period on the graph. DMS calculates the head/machine count by: Hours per Shift / Hours per Operation.
- Theme Select Options | Theme to change the appearance of the graph. Various themes and colors can be selected.
- Time Scale The Time Scale for the capacity graph can be one of the following:
- Shifts
- Days
- Weeks
- Months
- Quarters
Manufacturing
- New Job select Manufacturing | New Job to add a new job.
- Edit Job To edit the job select Manufacturing | Edit Job, or right click on the job panel or the operations grid and select Edit Job to edit the existing job. To edit the current job's operations you can double click on an operation in the operation grid or right click and select Edit Job/Operations.
- Calendar/Capacity Changes are changes you want to make to the manufacturing calendar such as holidays, planned overtime, planned shut downs, etc.
- Resources is used to add, edit, delete resource settings.
- Schedule Run Run a global schedule.
- Job Updating Select Manufacturing | Job Updating to manually enter detailed time updates to the job. You can also access Job Updating by right clicking on the job panel or the operations grid and selecting Update Job.
- Start/Stop Clock Select Manufacturing | Start/Stop Clock to to update a job with times and quantities typically used by a timekeeper or shop floor personnel.
- Start/Stop Clock Edit If using Start/Stop Clock Updating, select Manufacturing Start/Stop Clock Edit to edit existing start/stop clock entries.
- Quick Updating Select Manufacturing | Quick Updating Quick Job Updating to perform a quick job update with times and quantities without all the displayed details used in Job Updating.
Other commands are:
- Linked Operations Right click on the operations grid and select the command Link Operations to display the Linked Operations Window to link two or more operations together.
- View Dispatch Display You can view the dispatch display for the current operation by clicking on a bar in the capacity graph. The dispatch display will appear for the selected operation's resource.
- Type of Work (Capacity) The type of work appears above the capacity graph for the capacity bars (orange bars) and can be changed by selecting a new type of work.
- Type of Work (Ribbon) A ribbon can be added as a third parameter to the capacity graph displaying a different type of work. The ribbon enables you to compare the capacity type of work, the current load, and a ribbon type of work all in one graph. The Type of Work Ribbon prompt appears above the capacity graph.
- Data points The data points above the capacity graph and are the number of shifts, days, weeks, months or quarters you want to appear on the graph.
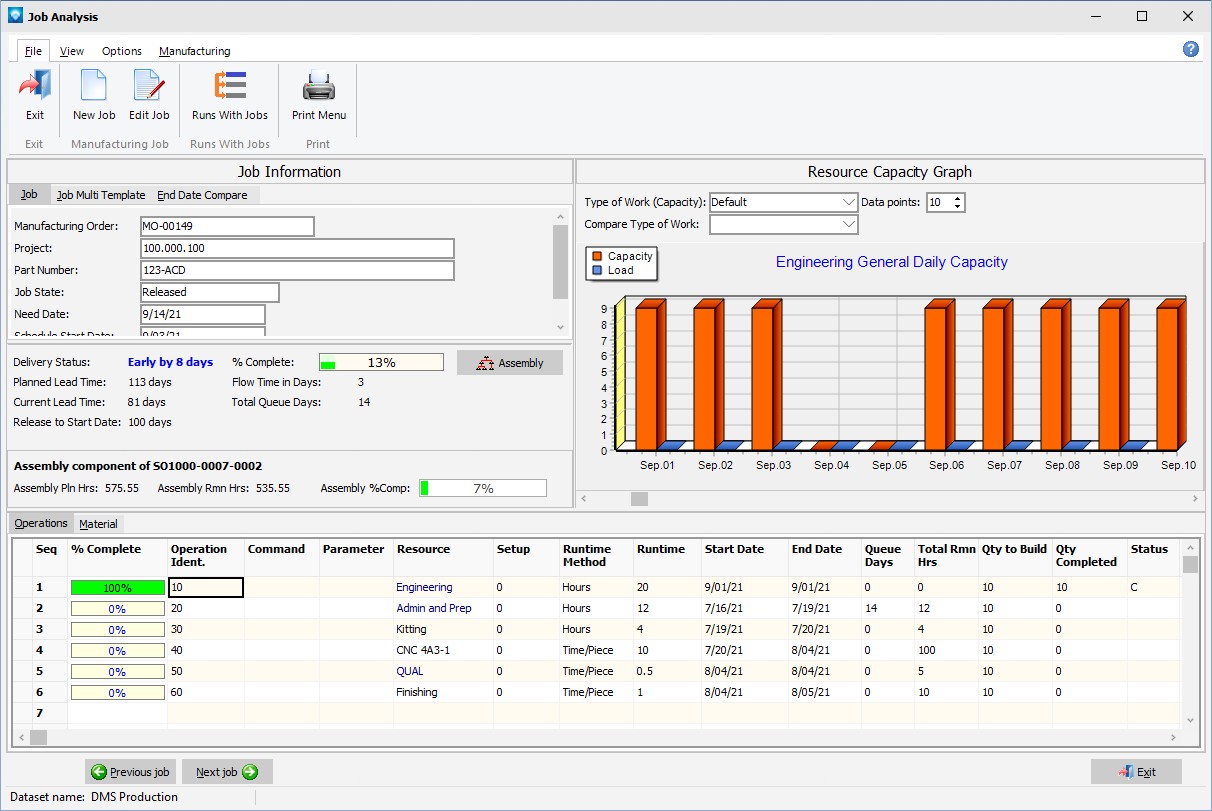
The Job Analysis will display a button  if the job is part of an Assembly. Clicking on the button will will display the assembly structure in the Assembly Display window. A planned versus actual and percent complete will also be displayed for the entire assembly. The example below shows a a job that is a component within an assembly:
Job Analysis will display a button  if the job feeds or is fed by another job via a BOM Link. Clicking on the BOM button will display the associated BOM links in the BOM Link Display.
Both the Assembly and BOM Link buttons will be displayed if the job is an Assembly Component and a BOM Link as in the example below. The buttons and the assembly/BOM link status appear on the second panel of the Job Information on top on the right side.

